New Feature in 3DCS Version 7.7 - See all the new features in 3DCS V7.7
Why this is helpful -- Show the effect of a single tolerance on the model to demonstrate it's GeoFactor or overall variation without other influences. This is a very helpful demonstration tool for showing your team or managers problematic tolerances and inputs.
Visualize Effect is a tool that allows users to graphically see the impact of a single tolerance or float in the model.
One input at a time is deviated to high, median, and low sequentially in the model. When the model is in its built position this represents a graphical visualization of how individual tolerances or floats translate through the model. It is meant as a tool for the user to better understand the contribution of a specific tolerance or float that they may be surprised to see (or not see) in the results provided by the 3DCS Sensitivity Analysis.
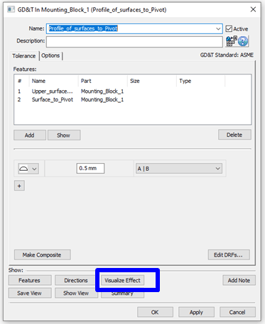
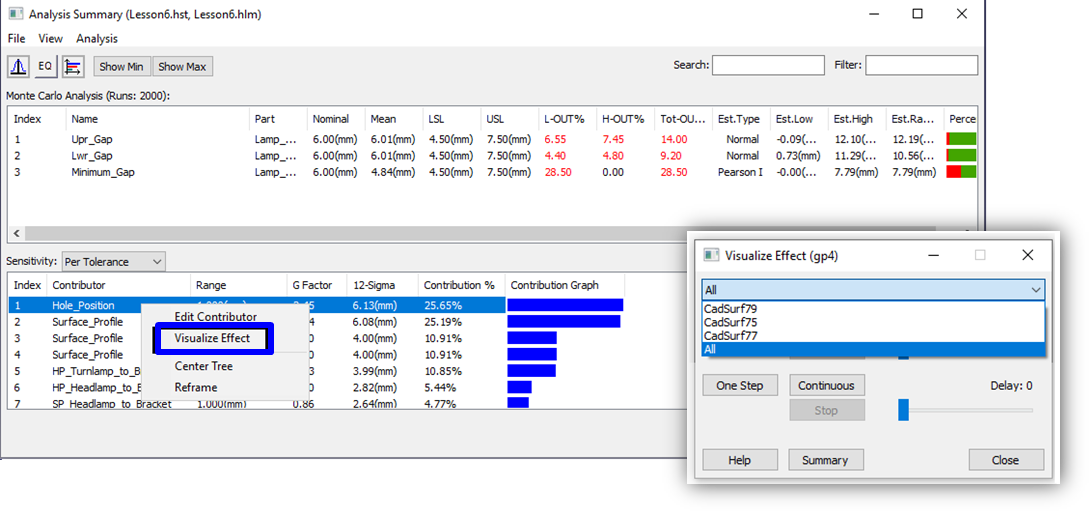
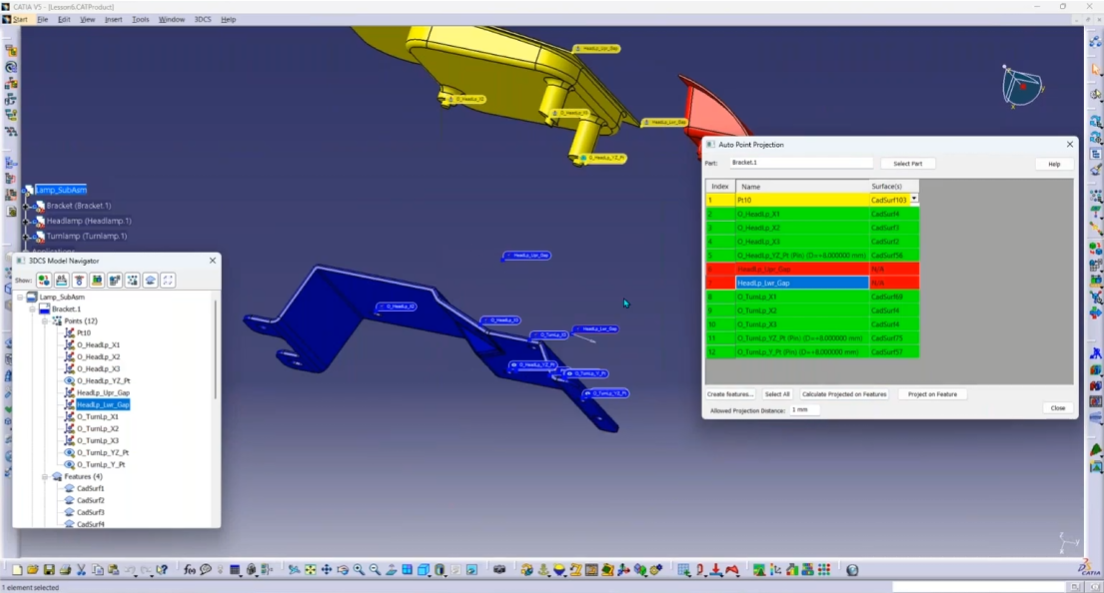
The Visualize Effect dialog as well as its features and function are shown below:
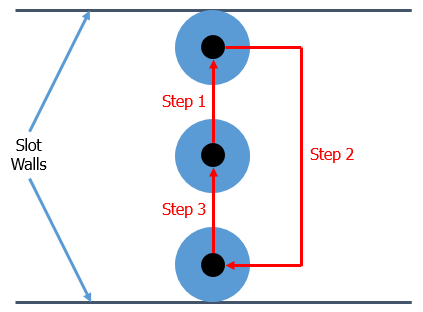
For a Profile or Linear tolerance, this tool will deviate each feature (one at a time) to high position, then low position, then back to the median position. This process is the same process 3DCS has used in the past for HLM sensitivity.
The steps of the Visualize Effect tool on a Profile or Linear tolerance are shown in the figure below:
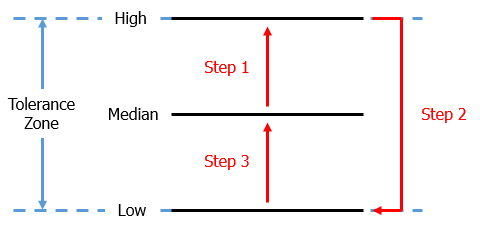
When the model is in its Nominally Built position then the parts in the model that would be affected from this feature deviating will also move.
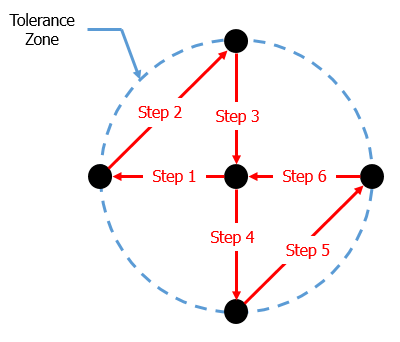
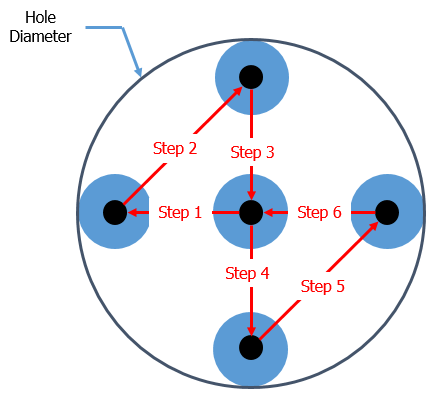
For a Position or Circular tolerance, this tool will deviate each feature (one at a time) to six positions, hitting four locations around the circle (separated by 90°) as well as hitting the middle location twice. The middle is hit twice so that each direction of the Position of Circular tolerance can be isolated.
The steps of the Visualize Effect tool on a Position or Circular tolerance are shown in the figure below:
When the model is in its Nominally Built position then the parts in the model that would be affected from this feature deviating will also move.
Visualize Effect can also show variation coming from Hole-Pin or Slot-Pin float. The pin is always either centered in the hole/slot or the OD of the pin is touching on a wall of the hole/slot.
For Hole-Pin float, the effect is graphically shown using the same process that is used for Position tolerances in the Position Tolerance section above. The figure below shows the process for a very small pin floating in a large hole:
For Slot-Pin float, the effect is graphically shown using the same process that is used for Profile tolerances in the Profile Tolerance section above. The figure below shows the process for a very small pin floating in a large slot:
The model must be in its Nominally Built state for the floats to display any effect.


North American Innovation Center
28064 Center Oaks Ct A, Wixom, MI 48393
Call us: +1 (248) 504 6200


No Comments Yet
Let us know what you think