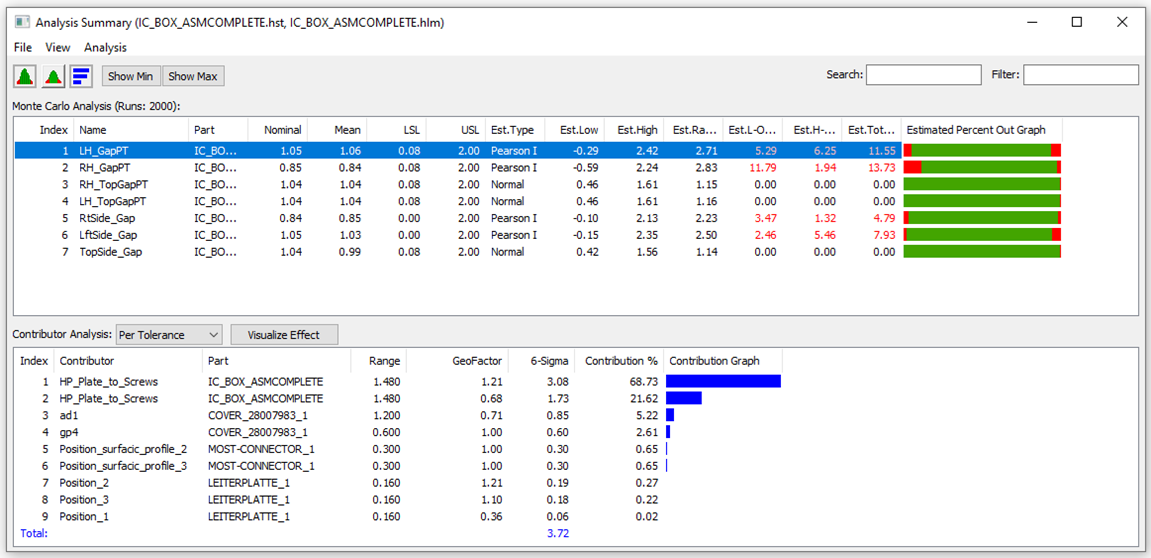
Tolerance Stack Up Simulation - Table View
New Feature in 3DCS Version 7.7 - See all the new features in 3DCS V7.7
Why this is helpful -- Easy to view and navigate tolerance simulation data in one window
|
The Analysis Summary window displays the results in a table list of measures. This output window contains all the statistical data of the each measure associated with the 3DCS model. A statistical report for each measurement is generated. By double clicking on any of the measurements in the top window, the user can see the detailed analysis results, or by double-clicking on the contributor in the lower window, display the tolerance information.
|
Complete Process Report
- Histogram
The histogram is a type of bar graph that plots frequency distributions. The histogram consists of bars that represent the complete range of the data. Each bar has a high and a low limit. Each measurement value, generated by the simulation, is assigned to the bar within whose range it falls in. The height of the bar represents the number of measurement values within it. A histogram is generated for each measurement of the assembly model.
- Frequency
The frequency of measurements that fall in the range of a particular bar of the histogram.
The Upper Spec. Limit (USL) and the Lower Spec. Limit (LSL) are displayed as two lines on the histogram. The histogram bars outside the USL and LSL may be denoted in a different color signifying that they are out of range. If the spec limits are very large as compared to the simulated data distribution, the histogram does not display the spec limits.
The histogram's +3 Sigma and -3 Sigma from the Mean values are displayed on either side of the Mean value.
A detailed description of all the statistical data is given: Type, Measure, Runs, Nom. [Nominal], Mean, Sigma, Min, Max., Range, CP, CPK, LSL, USL, L-Out, R-Out and Curve Fit associated with the histogram.
- Name: Displays the name given to identify the measurement. Example: MEAS1, CASTER, TOE etc.
- Type: The top section of the process report contains the Type of measurement. It displays the type of measurement used for that particular output. Example: Pt. Distance, Line Angle etc.
- Description: Displays the measurement description as shown in the measurement dialog box.
- No Builds: Displays the amount of builds that failed to build.
- Runs: This is the actual number of Monte Carlo simulation runs that have been performed on the assembly build.
- Nominal
The Nominal value of the measurement is the value when all tolerances associated with the measurement are at their nominal values and all moves have been performed.
- Accept
Accept represents the number of accepted builds, and is calculated as the difference between the Total Runs and Calculated Failed Assemblies.
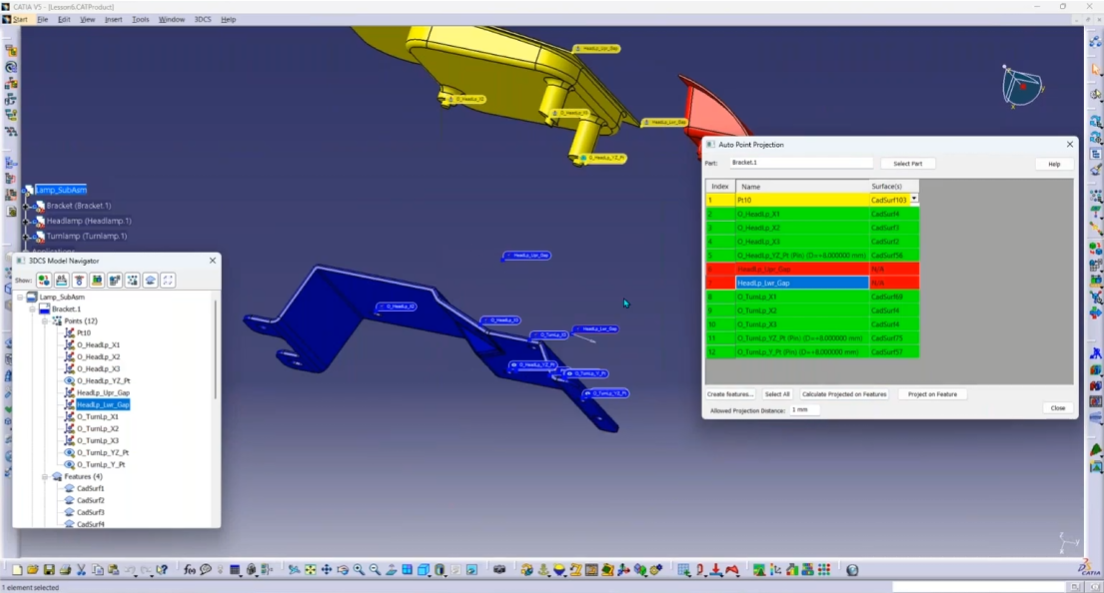
See for yourself in this video clip from the 7.7 Webinar:
Join DCS to Learn How to Use All the New Features in the New Version 7.7


No Comments Yet
Let us know what you think