
Let's talk about the 4th habit. In Covey's terms; Think Win-Win.
One of my favorites is to think Win-Win or no deal.
This is something that my children and I talk about a lot. They are in business. We try and find when we deal with others a way where everyone can win.
But I want to spin this a little differently for those who are engineers, particularly dimensional engineers. When we think Win-Win we want to be data-driven, and not driven by data.
Remember, without data all you have are opinions, and most of them stink. Too often, when people don't have data they want to talk about it.
Who has been to a meeting where people want to talk and talk but they don't have any data.
This is a form of waste. (This could have been an email, right?)
You get into lead engineering and look at the organization and how we behave and find talking without data is a waste. Let's instead of talking about the problem, let's go get some data to make decisions.
There are two cases,
It's pretty simple.
DCS can help with that. That's one nice thing about working with DCS, we have so many tools and methods to help with this. To create and analyze new data, we can use 3DCS Variation Analyst tools that will help us to create models to create data and check hypotheses.
QDM SPC is a great method for pulling the data that has been generated at the plant through build and measurement data.
Both tools are great, and it helps that they have a synergy together.
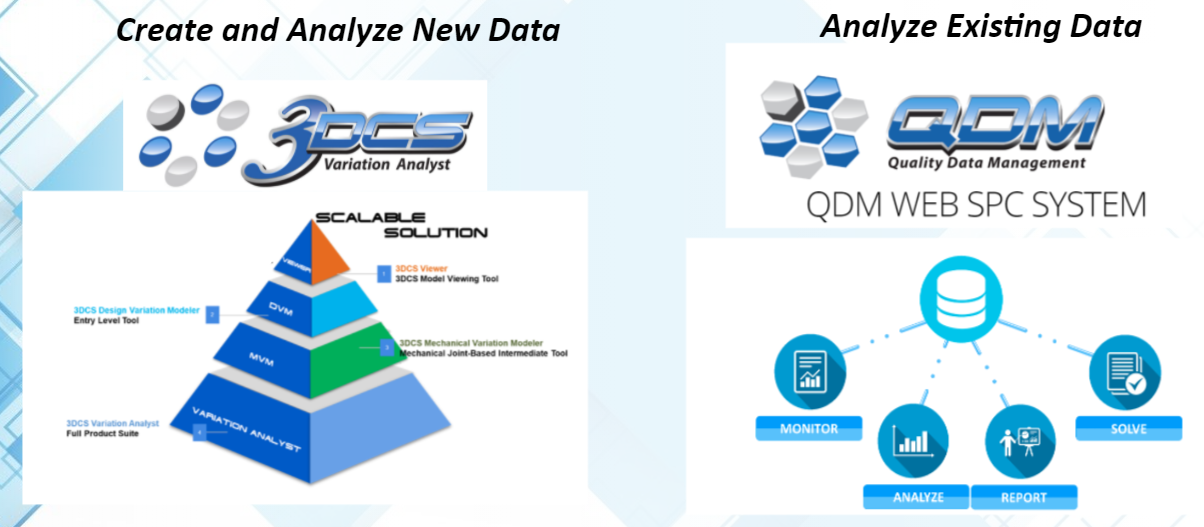
But when you get the data, let's make sure we are using it wisely. We live in a data-rich world because we can get a lot of data from QDM from the plant, or generate a lot of data through analyses in 3DCS.
BEWARE! Be careful of mining data without a goal!
How do you know if you have the right data? Make sure you are following the data.
So one of the things again, the synergy of the seven habits is how they interplay with each other. Hypothesis, confirmed or busted, is related to this. How do you know you have the right data? Check it against your hypothesis. Is my hypothesis right or wrong?
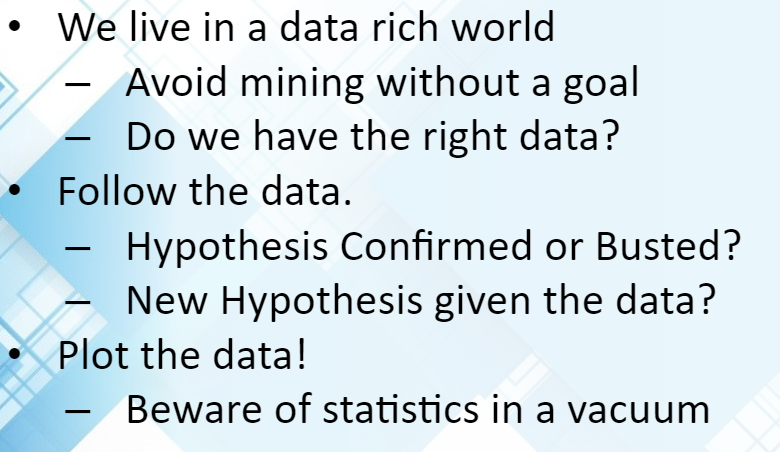
Then given what I learned from this set of data, what are the things I've learned. Then form some new hypotheses.
One of the things I want to discuss is Plotting the Data. Is this a tool or a method? I guess it is both, but beware of statistics in a vacuum. Plotting data puts context on the data and lets you see the big picture more clearly.
I love statistics. I went and got a degree in statistics because I'm a geek and just love them. However, I'm hesitant to use statistics in a vacuum, and even more so to look at statistics without looking at the plot of the data which is often more important than the statistics themselves.
I've spent about 25 years at General Motors, and I'd like to talk about my first week and last week at GM before I retired.
It is a similar story; the first week they were launching a vehicle and I knew one of my teammates had been struggling with a problem. My boss asked me to step in and help him with it.
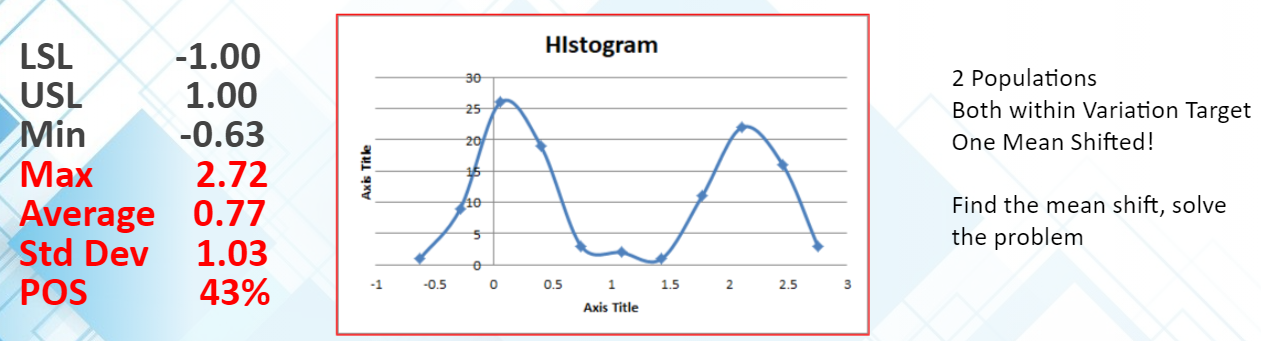
He showed me all this data. Here is some example data:
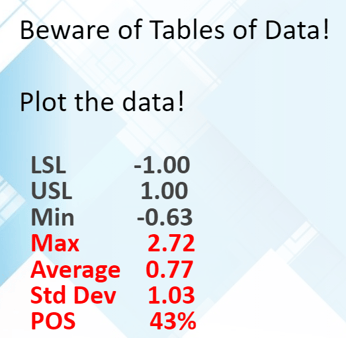
We have a lot of variation, significantly more than they wanted, and a huge proportional percentage out of specification. Given this, they kicked off a new tool to build a new stamping die and were going to kick off a new revision to the weld tool to get this variation down.
I asked, can you plot this data?
Nah, we're way past that. Well, when we looked at it:
When we looked at it, everyone just stopped and went 'oh!'. They had developed a mental model based on the statistics of a univariate normal distribution with a plus or minus 3. That is what their mental model was given their statistics on the left.
Look at the data on the right.
What was actually happening was the creation of two populations; one population was pretty much centered around the mean and pretty in-spec, and we had another population that was shifted to the right.
Oooh, we didn't see that coming.
Well, what happened was that the system had not had poke-a-yoke or error-proofing done. So in assembly, the operator would install the part into the wrong state, so the hump on the left is when it was installed correctly and the one on the right was when it was installed incorrectly.
My issue went, was not to blame the operator, because it was a blind load. Getting the right position, with no tactile feedback, meant that there was no way for the operator to know if it was correct or not.
So we made a small change to the part that cost about 3 cents. When we put in the change and it was error proofed, the hump on the right disappeared and now we're in spec, at a cost of about 3 cents. Oh and by the way, cancel the weldment, cancel the stamping tool. Your guys were staring at numbers, and not plotting data.
That was my first week. Let's talk about my last week.
It is similar but different. I was working on General Motors' full-sized trucks. The biggest program at GM, as it is where they make their money. My job there right before I retired was to lead the problem-solving team for the full-sized trucks. They called me when they had a problem. The description of the problem was all about numbers. They would say something like, the true position of a hole which can be no more than a true position of 2, so no more than plus or minus 1 in any direction from where it should be, is out of specification consistently.
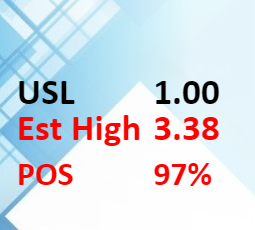
They were looking at their percent out of spec. It was 97% with an estimated high of 3.38.
What a mess, what are we going to do with this?!
Again, I asked, let's just plot it. We have two positions, the x and z components. Let's just plot it. If you look, the circle in red is where it should be and you get very few parts in spec.
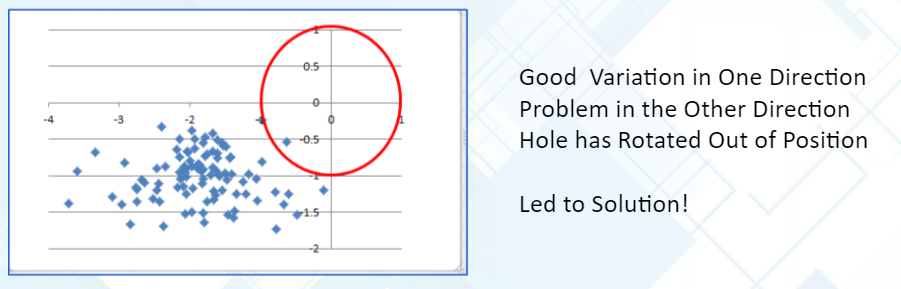
If I look at this, it's kind of interesting, if you look at the z-direction it is actually pretty much in spec, just off-center. The variation in the x-direction is much larger and there we have a problem.
What does it look like to me? It looks like the part was rotated down and rearward.
Once they realized that the part was rotated and had more variation in one direction than the other, we were able to quickly find the solution that got it in-spec.
Well, people have gotten into the habit of having all these tools that give data and make people used to looking at numbers without plotting the data. I'm saying, get away from numbers and start looking at the plots and almost always this will give you clues.
Download the eBook below to get all 8 habits in one pdf


North American Innovation Center
28064 Center Oaks Ct A, Wixom, MI 48393
Call us: +1 (248) 504 6200


No Comments Yet
Let us know what you think