Discover how to seamlessly compare and analyze scan results across your organization using a unified interface.
In today's fast-paced industrial environment, having a centralized system for scan data analysis is crucial. Quality data is often collected using multiple scanning systems across various departments. This fragmented approach can lead to inefficiencies and data discrepancies, making it challenging to get a holistic view of product quality.

A unified interface, like QDMWEB QualityScan, allows organizations to consolidate all scan data into a single platform. This not only streamlines the data management process but also ensures consistency in data interpretation. With all scan results accessible in one place, teams can make more informed decisions, leading to improved product quality and reduced time-to-market.
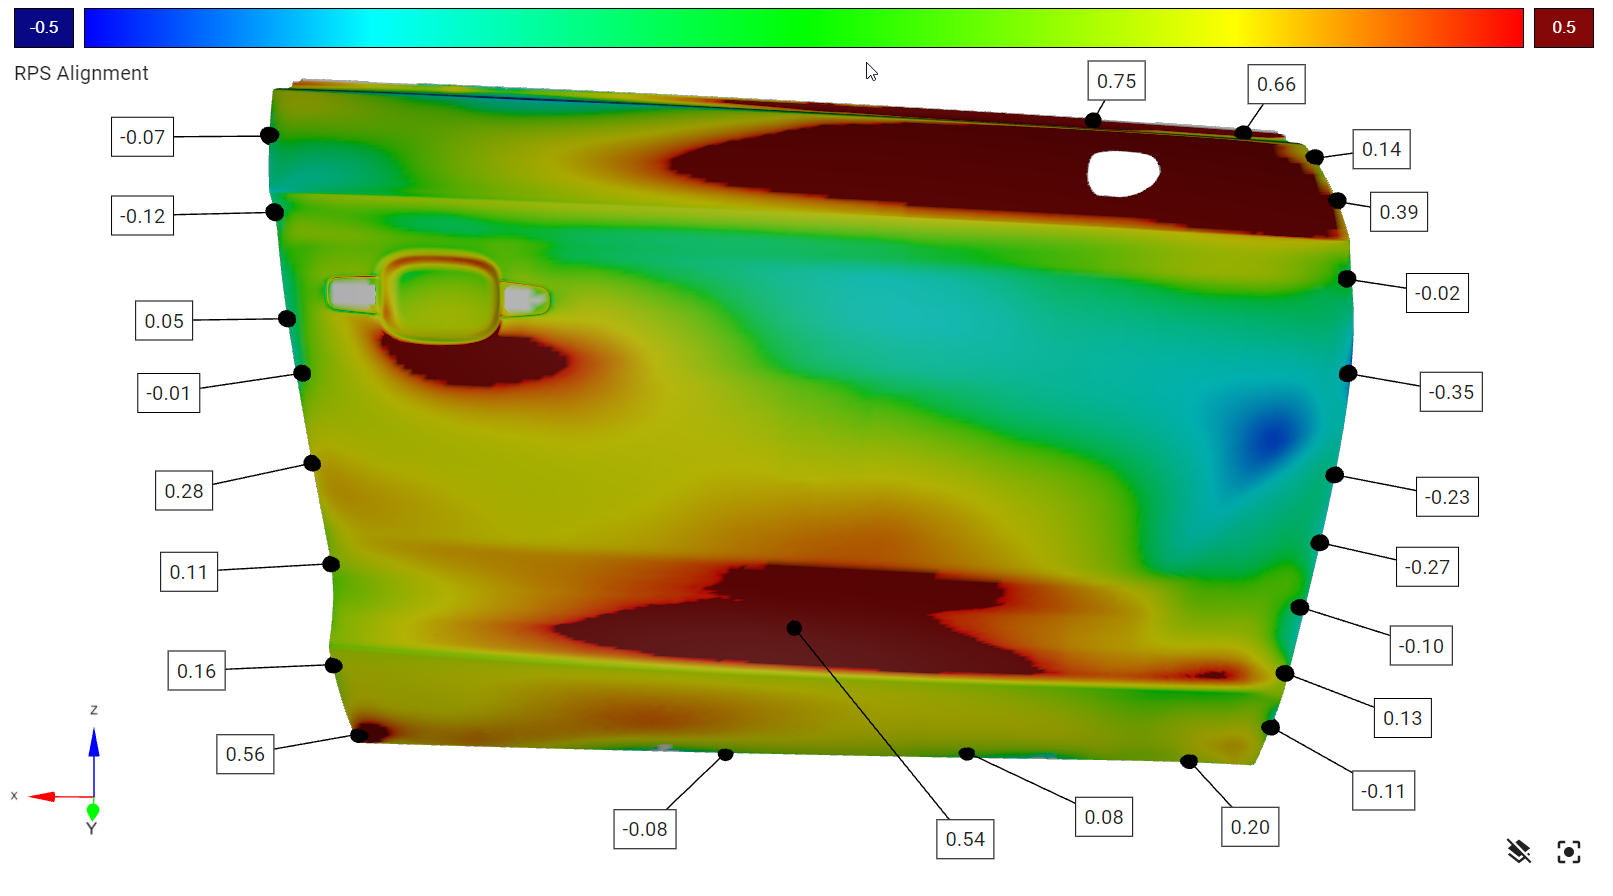
Color maps are a powerful tool for visualizing scan data on 3D CAD models. They provide an intuitive way to interpret complex data, making it easier to identify areas of concern. By overlaying scan data on a 3D model, users can quickly see deviations from the desired specifications, represented in various colors to indicate the severity of the discrepancies.

This visual approach enhances communication across teams, as it allows everyone to understand the scan results without needing extensive technical knowledge. It also facilitates quicker identification of quality issues, enabling faster corrective actions. The ability to view scan data in a 3D CAD environment ensures that all stakeholders are on the same page, fostering a collaborative approach to quality management.
Comparing scan results efficiently is essential for maintaining high-quality standards. Best practices for comparison include using standardized metrics and ensuring that all scans are conducted under similar conditions. QDMWEB QualityScan provides tools to easily query and compare scan results, allowing users to benchmark parts against each other or against predefined standards.

Regular comparisons help in tracking quality trends over time and identifying recurring issues. By adopting a systematic approach to comparing scan results, organizations can ensure that quality improvements are data-driven and consistent. This not only helps in maintaining product quality but also in meeting regulatory requirements and customer expectations.
Sensitivity analysis is a critical component of in-depth scan data analysis. It involves highlighting the highs and lows of scanned parts to provide a more detailed view of the data. This technique helps in identifying subtle variations that might be missed in a standard analysis, offering a deeper understanding of the part's quality.

QDMWEB QualityScan's sensitivity analysis tools enable users to fine-tune their analysis, focusing on specific areas of interest. By highlighting these areas, users can better understand the root causes of quality issues and implement more effective corrective actions. Sensitivity analysis thus plays a vital role in enhancing the overall quality control process, leading to more reliable and high-quality products.
These Stories on SPC
No Comments Yet
Let us know what you think