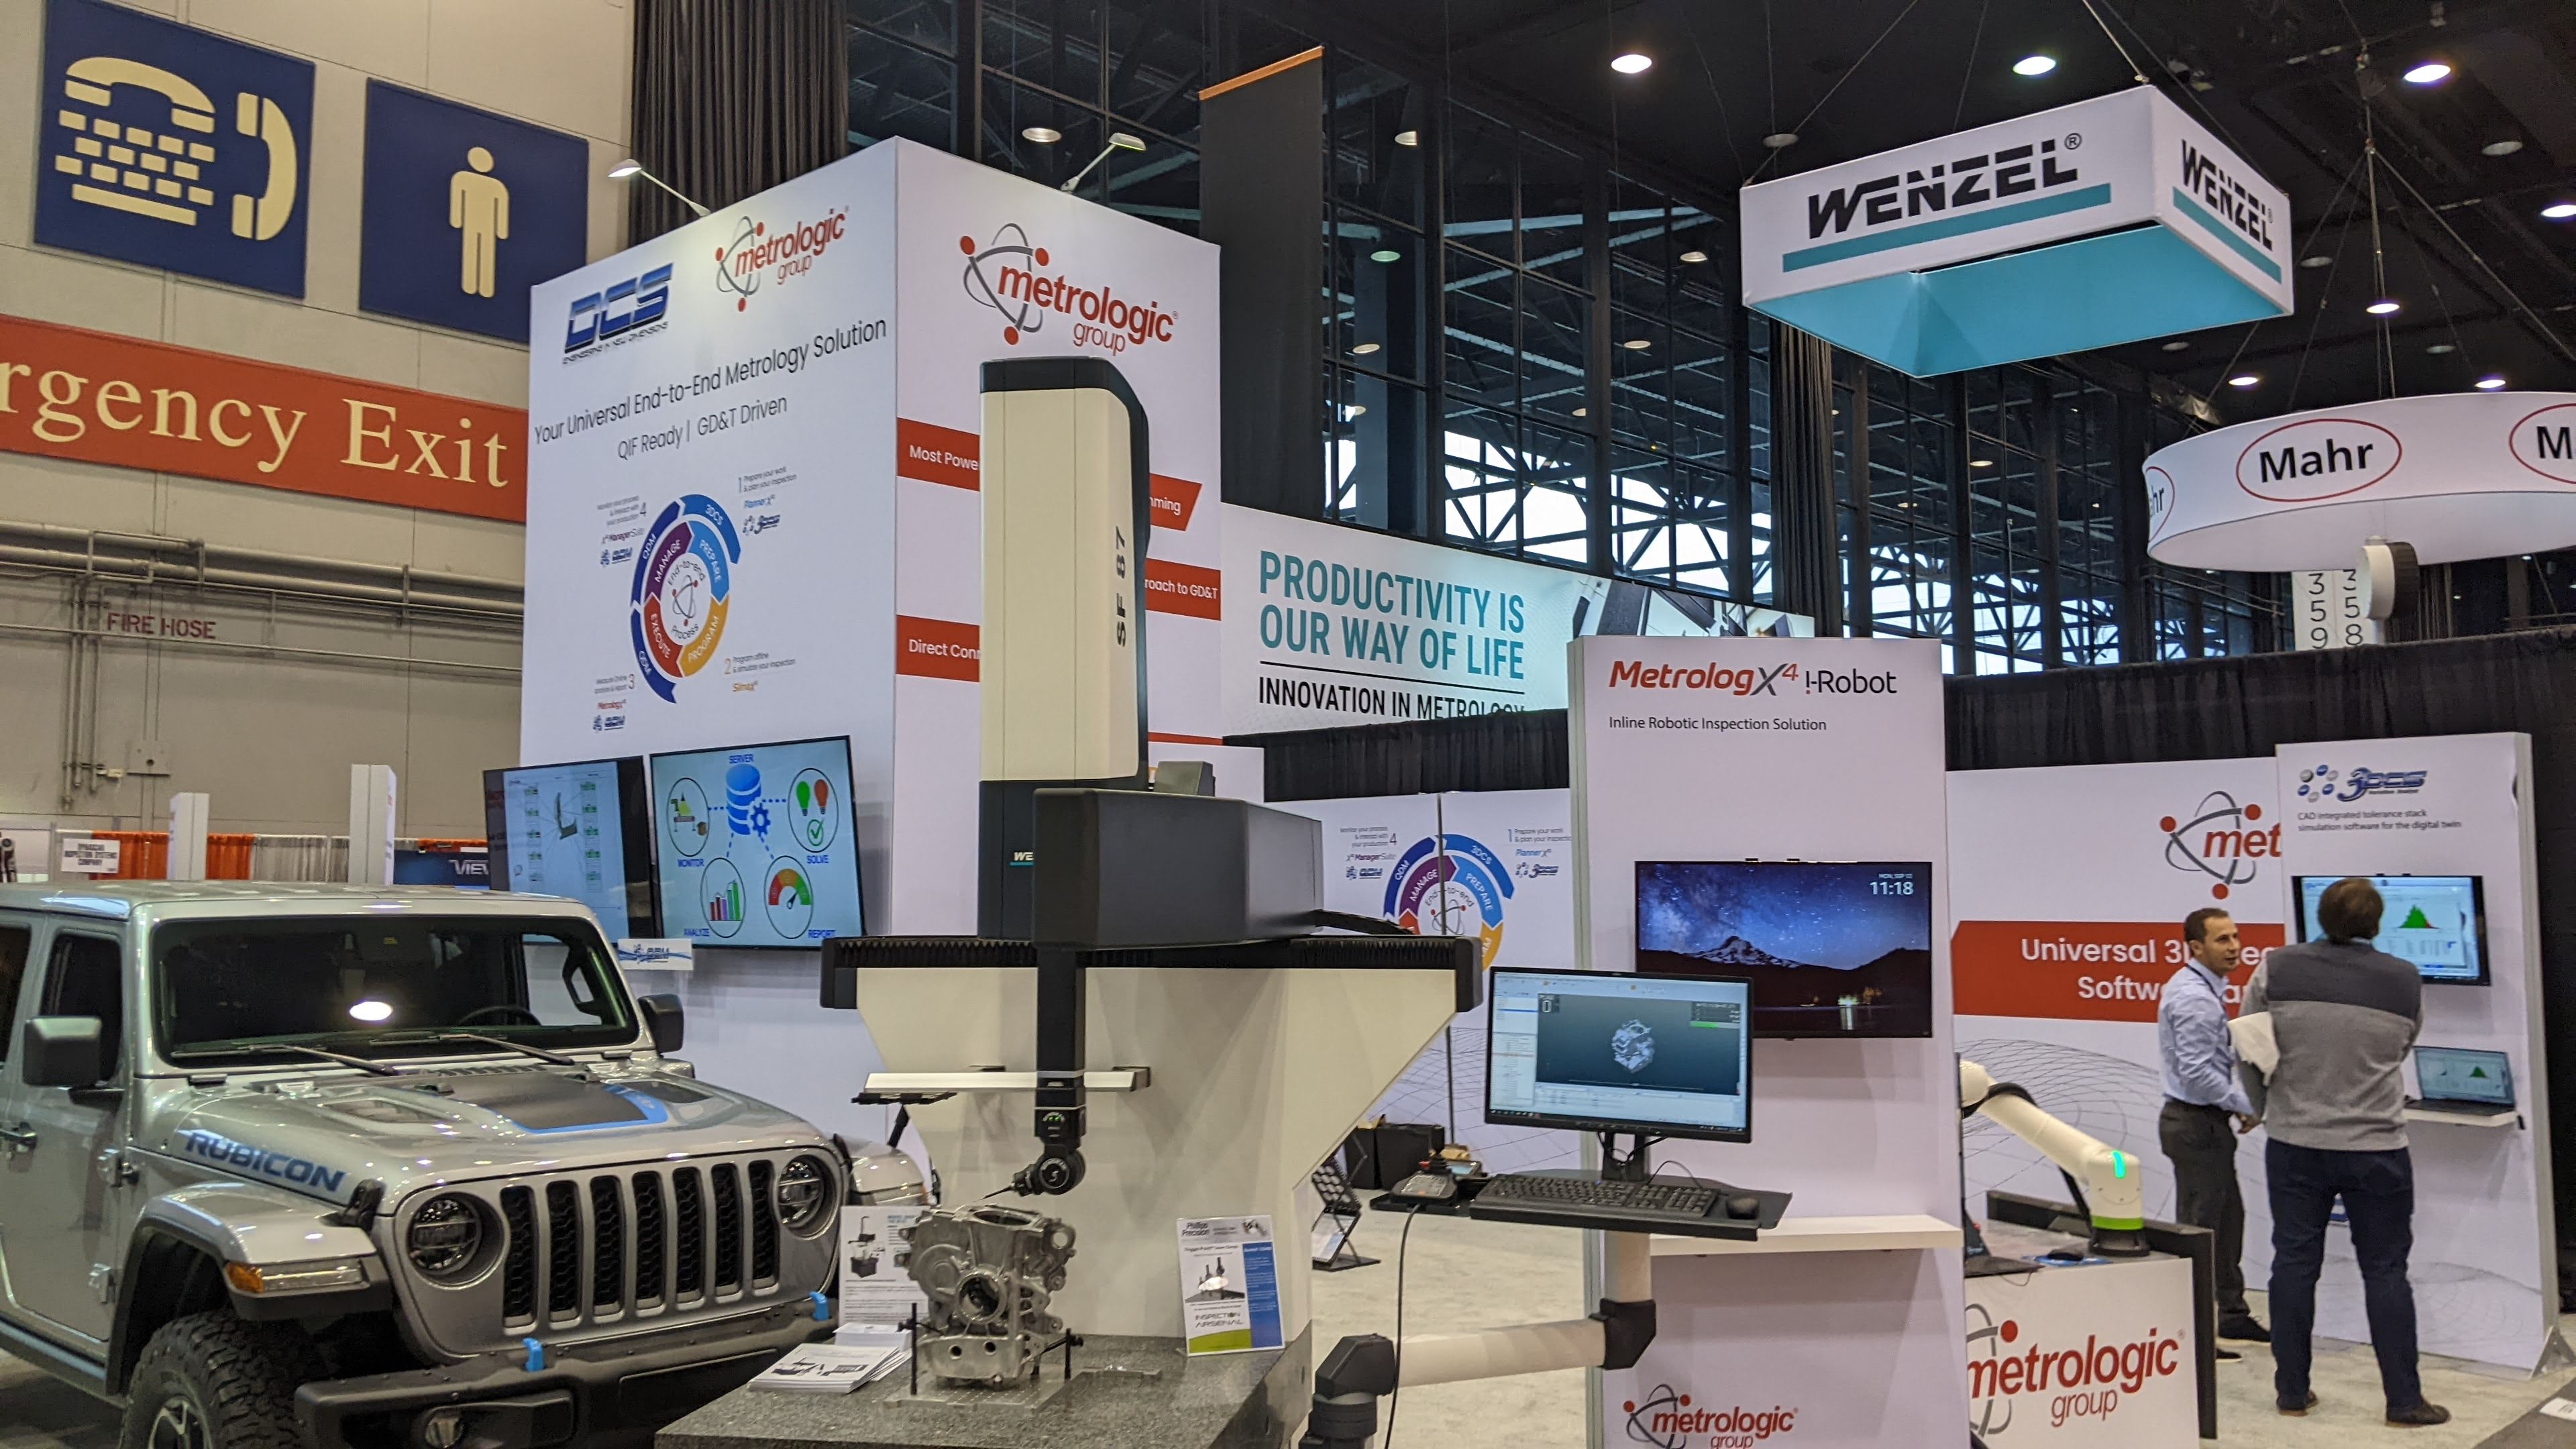
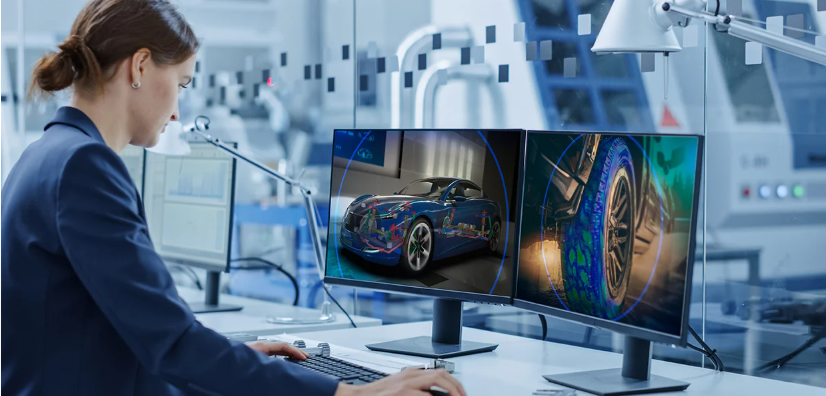
At IMTS, DCS and Metrologic wanted to give visitors the chance to see what a closed-loop manufacturing process looks like in practice. This was, of course, a microcosm of what occurs at a plant or large enterprise, but seeing the different pieces and how Quality 4.0 can be leveraged to drive information downstream from design is a valuable vision that is often discussed, and rarely shown.
Here is your chance to see it

There is a lot to see here, so let me break it down for you.
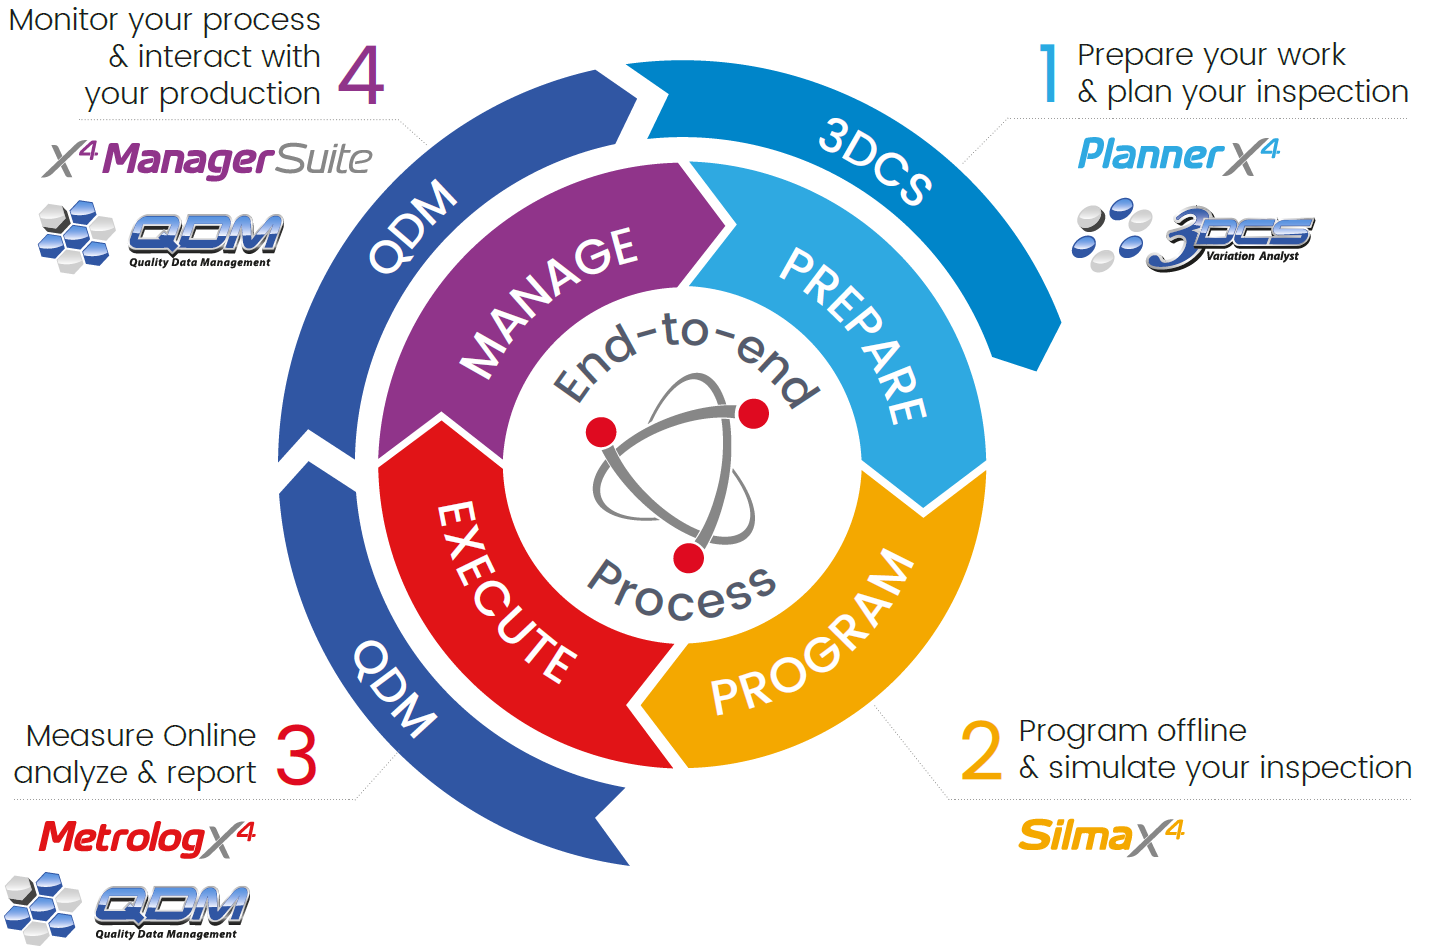
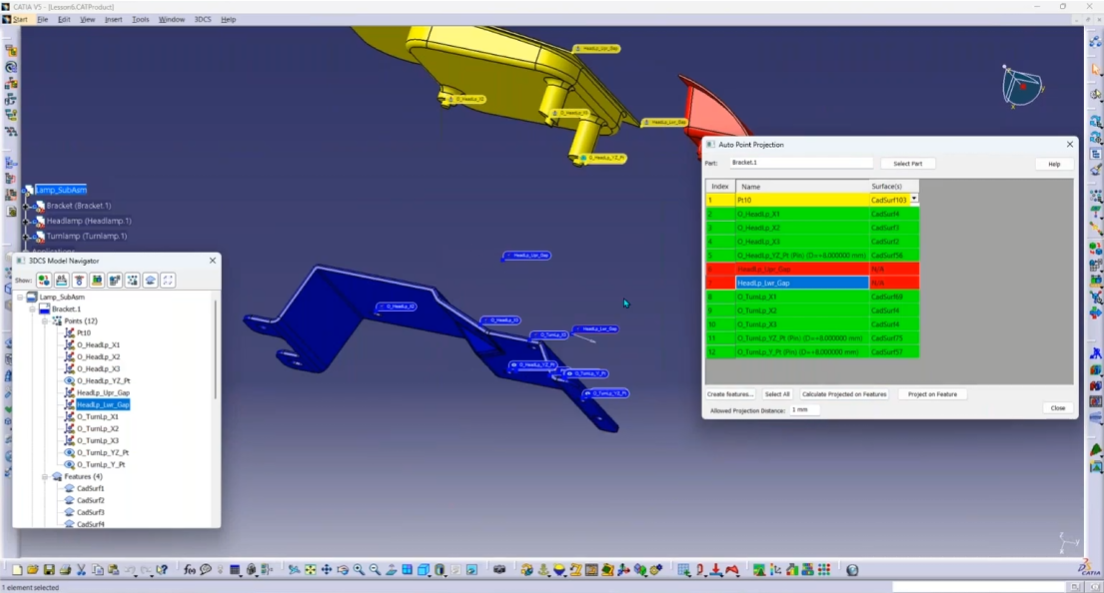
During the digital design phase, 3DCS, a variation analyst tool integrated into CAD, provides the tools to test, simulate, and create robust designs. The output from these models is a set of optimized GD&T, that is, set up to reduce manufacturing costs in non-critical areas, and honed for areas found critical to quality and at risk of non-conformance. This output GD&T is the driving force of the process, associated with CAD and machine readable for consumption downstream.
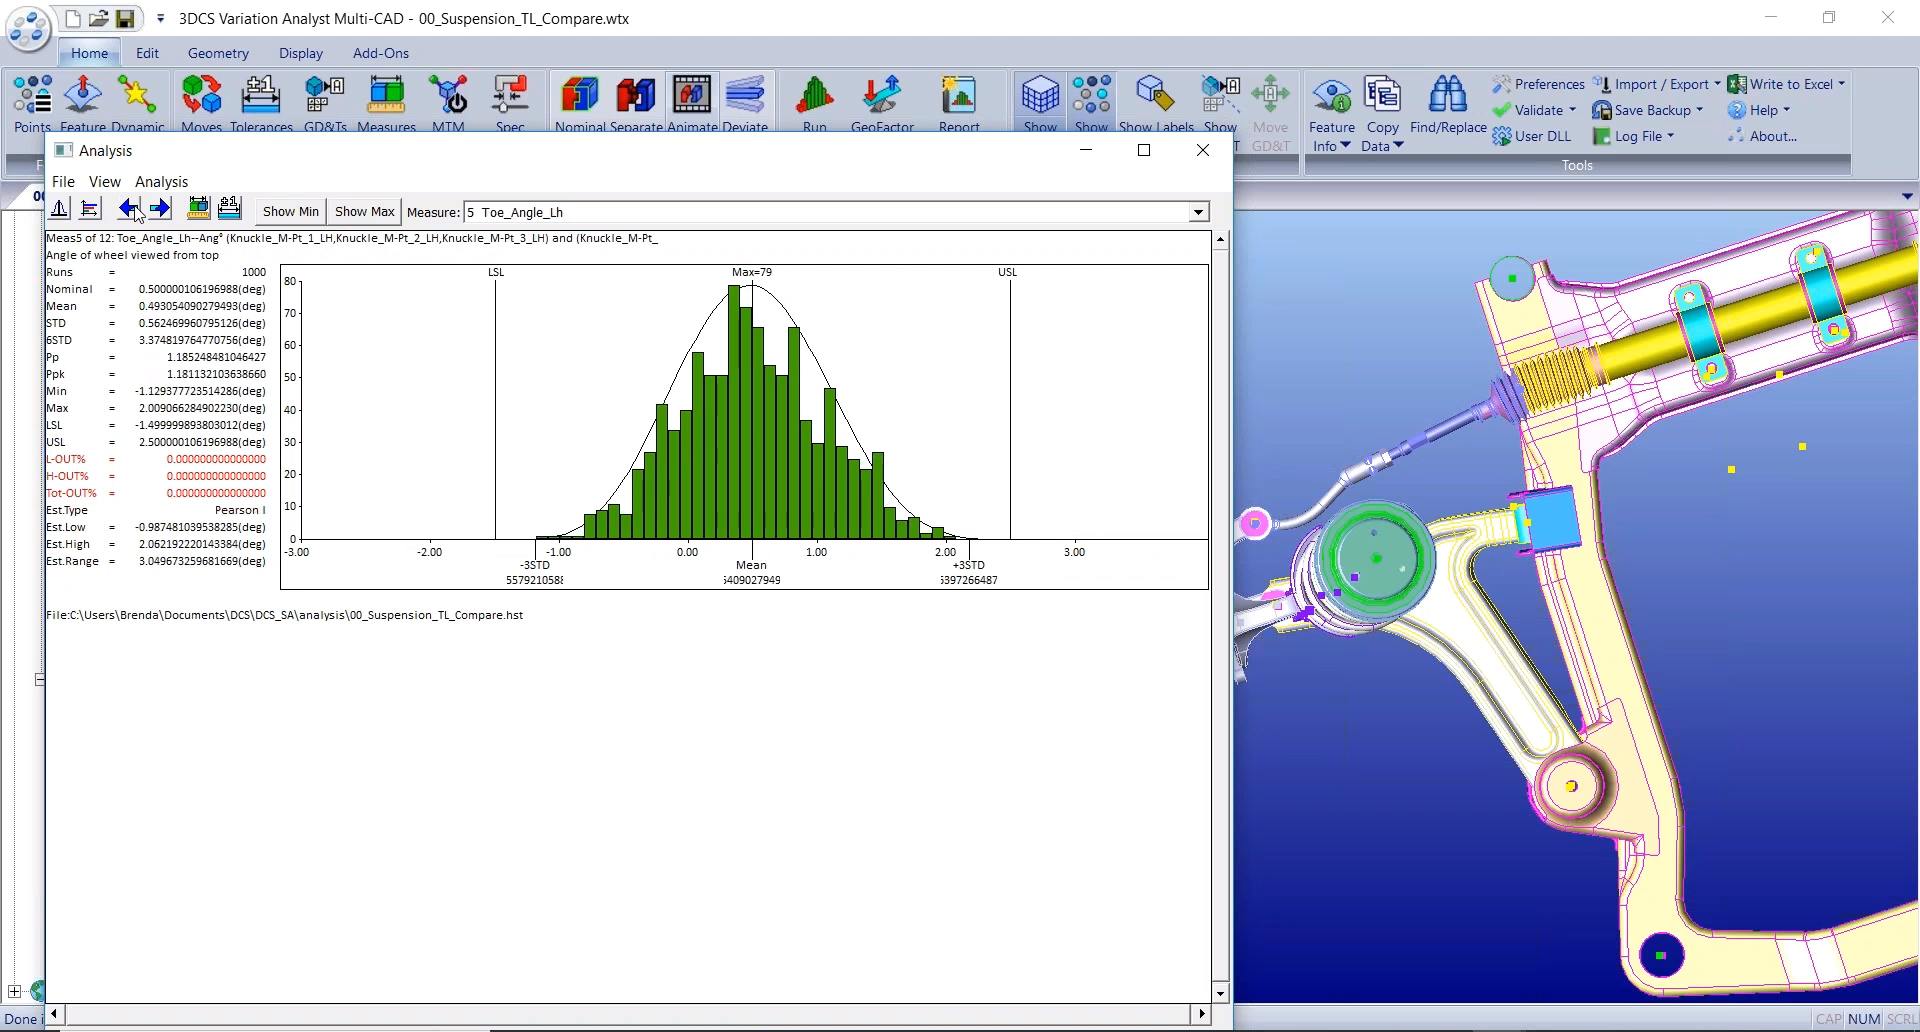
The GD&T created and optimized in 3DCS is then passed to Silma, which creates a measurement plan from the data. This plan can be programmed offline, keeping your line running while programming takes place. The program automatically interprets the GD&T, which can be virtually tested, ensuring that it is error- and collision-free once applied to the manufacturing process. In addition, its collision detection and automatic collision removal tools give you the ability to visualize, optimize and update in real your entire program probing path. Once complete, the measurement program is sent to Metrolog and your machines.
Whether you have a Wenzel CMM, a FARO measurement arm, a vision scanning system, Metrolog can utilize your measurement plan and make it a reality. With a plethora of tools for improved performance, Metrolog simplifies the day-to-day measurements and provides unique outputs to view the data before sending it downstream.
The PMI and GDS&T are now a data set from the part showing its conformance to specification. This is then repeated for 30 more parts, inline, or based on an organization’s quality standards. From here, the data is automatically read into a QMS SPC system for monitoring, analysis, and reporting --> QDM below.
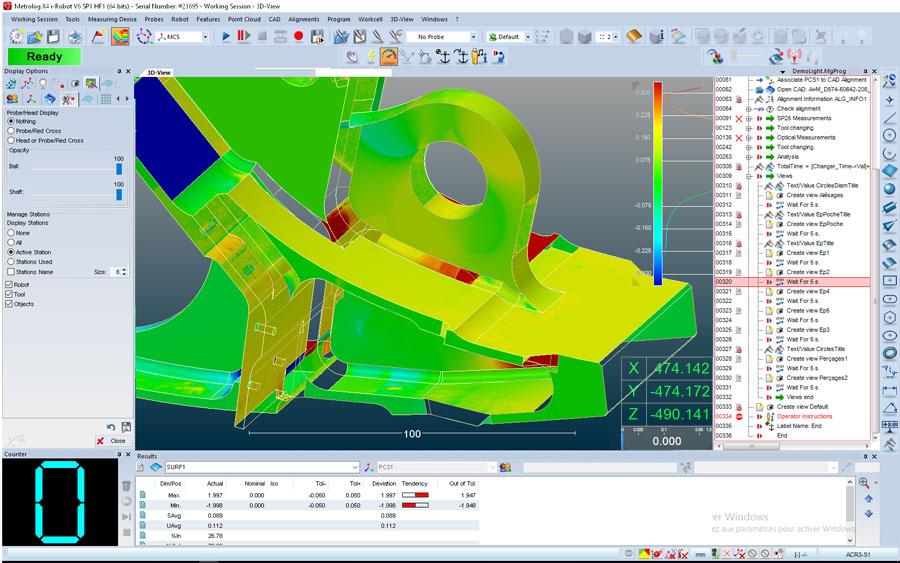
If you’re planning on using a robot to measure, the i-Robot technology is suitable for all industrial robots; it provides a production-ready metrology solution that is accurate, reliable, and flexible.
i-Robot is perfectly suited for all applications requiring flexibility and productivity while providing high metrological accuracy.
The outputs, much like with Metrolog, provide insight into your part’s conformance to spec, allowing the data to be displayed in different formats to make it easy to interpret.
These outputs are then read in by a QMS – Quality Management System – to provide a real-time understanding of the programs and access to powerful SPC for problem prediction and root-cause analysis.
QDM reads the measurement data as it is being completed by your machines. Metrologic technology seamlessly feeds the system to keep it up to date with minute-by-minute results, providing your team with real insight into your overall quality. View that data as customizable dashboards and SPC reports, or leave it out of mind until the system detects the start of a problem and alerts all stakeholders, and provides insight into the heart of the issue. This allows your team to focus on what they do best, without having to constantly sift through long Excel sheets of XYZ coordinates and outputs. Graphical reports and screens instantly show where problems are, when they began, and where in the manufacturing process.

Should an issue that cannot be quickly resolved arise, the measurement data can be quickly sent back to the design group for simulation and analysis, testing a solution to prove out its success before moving forward.
North American Innovation Center
28064 Center Oaks Ct A, Wixom, MI 48393
Call us: +1 (248) 504 6200


No Comments Yet
Let us know what you think