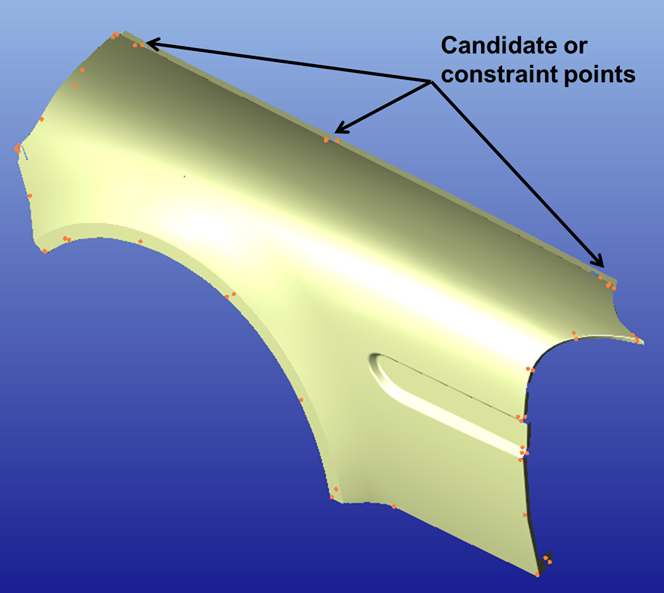
As an example of Datum Optimizer, a fender model as shown below was analyzed for both rigid and compliant values. Since DO does not require any assembly moves or tolerances, the fender model is a good example with only a single part and a set of points created as candidate and constraint points, as shown in Figure 3. However, to validate the optimized results, users have to add moves and tolerances to see the difference between using initial datum features and optimal datum features. This is illustrated in detail in the 3DCS Variation Analyst Tutorial and Help Manual [6]. The process of validating is not included herein, only the results are analyzed in this paper.
For the rigid datum feature case, to validate the performance of DO, a step-plane (3:2:1 locating scheme) move was used to locate the fender to a fixture, and a normal distributed tolerance was applied on selected datum targets. As shown in Figure 1, the model with initially selected datum features produced a risk of 26% out-of-specification and a poor process performance value (Ppk = 0.13). After datum optimization, three optimal primary datum features were found. The model with optimal datum features produced an excellent result distribution with only 0.8% out-of-specification, meanwhile increasing the process performance value (Ppk) to 0.81.
Figure 3: A fender model with candidate and constraint points

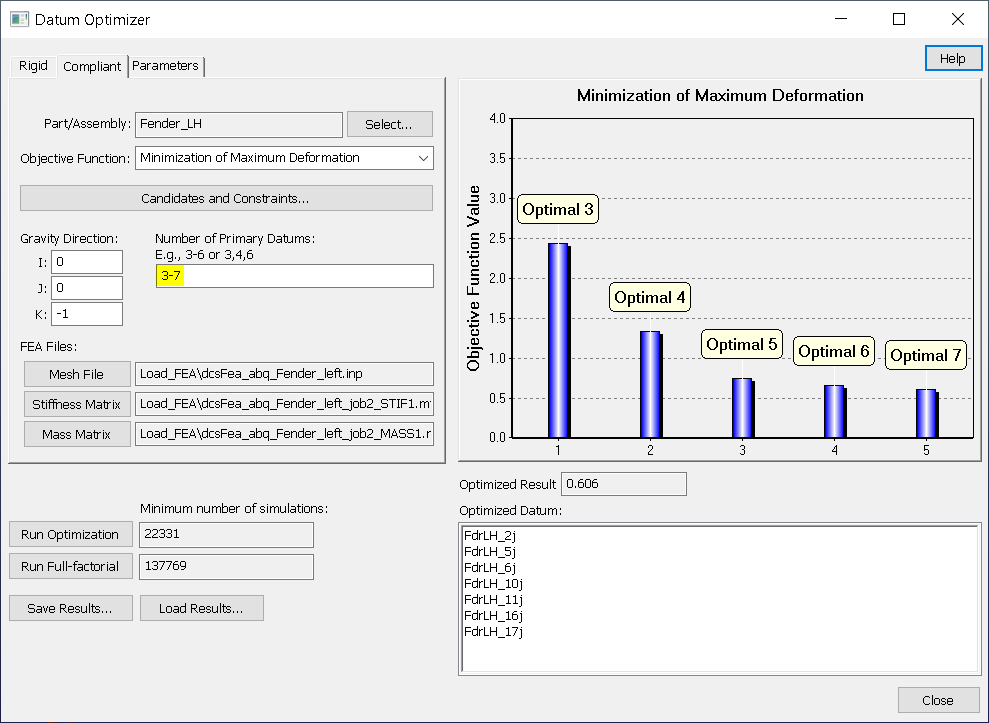
For the compliant datum feature case, lock DOF (boundary condition), clamp, and gravity moves were used to clamp the fender to a fixture. Part deformation caused by the clamping operation and gravity was measured. Five scenarios were then evaluated under the compliant case. First, DO found the best 3 of the 20 candidate datums. Then DO found the best 4 datums. Because the model is compliant, the part was overconstrained using 4:2:1 locating in the scenario. Best 5:2:1, 6:2:1, and 7:2:1 datum schemes were founded sequentially.
As shown in Figure 4, DO not only finds the optimal datum features such as optimal 3, optimal 4 etc., but also reveals the gain-cost relationship when users consider adding clamps to reduce the part deformation. For example, the maximum deformation decreases significantly from 2.44 mm to 0.74 mm (70% drop) when increasing the clamp number from 3 to 5. However, there is only an 18% drop when increasing the number of clamps from 5 to 7. The user should balance the gain and cost to make a decision, even though an 18% drop is still a great improvement.
Figure 4: Datum optimization for compliant fender

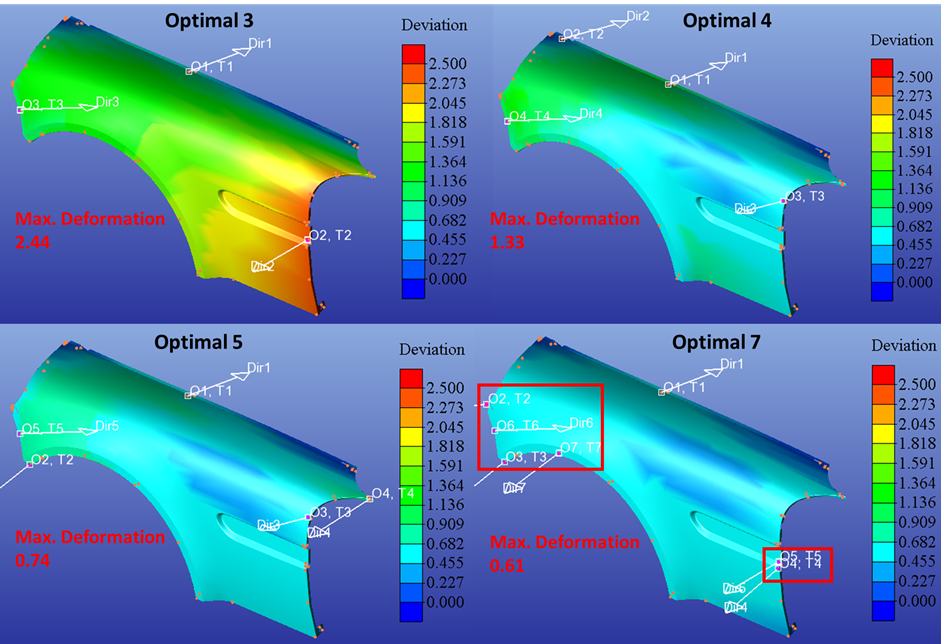
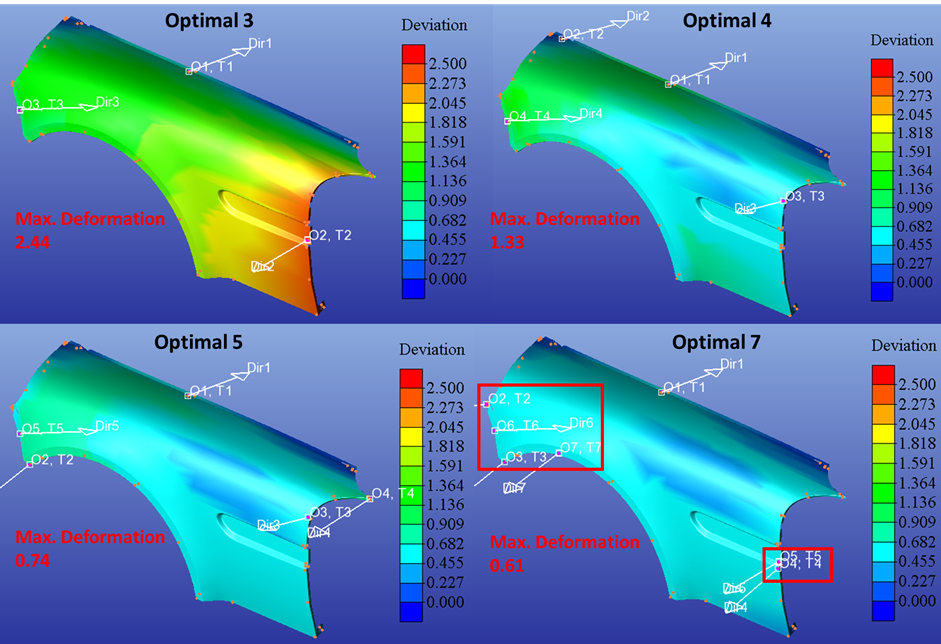
Figure 5 shows the deformation color contour and positions of optimal datum features for different numbers of clamps. As can be shown in the color contour, with the increasing number of clamps, the maximum and overall deformation was reduced significantly. However, in the bottom-right figure, even though the deformation is minimum, multiple clamps are positioned close to each other (within red boxes). In this example, the user should stop adding clamps after finding 5 optimal datum features, since adding two more clamps cannot significantly reduce the deformation, and overcrowding clamps increases the cost. Therefore, DO tells users not only where the optimal locations are to put clamps but also when to stop adding more clamps.
Figure 5: Deformation color contour for different number of optimal clamps

Datum Optimizer is a tool to find the optimal datum features for manufacturing and assembly processes, which does not require any assembly moves or part tolerances on the model. It only requires a single part with a set of candidate points and FEA files if conducting compliant deformation. Using DO during the design stage and prior to production, users can eliminate or minimize the rework and tuning of mechanisms to select the proper datum features while retaining a high confidence in passing Gage R&R.
To achieve the goal of minimizing rigid part variation or compliant part deformation caused by gravity and clamp operations, DO uses a state-of-the-art genetic algorithm to efficiently find optimal datum features from a candidate set.
As shown in the example, DO not only shows users where the optimal locations are but also suggests when to stop adding more locators due to diminishing returns.
These Stories on CATIA
No Comments Yet
Let us know what you think