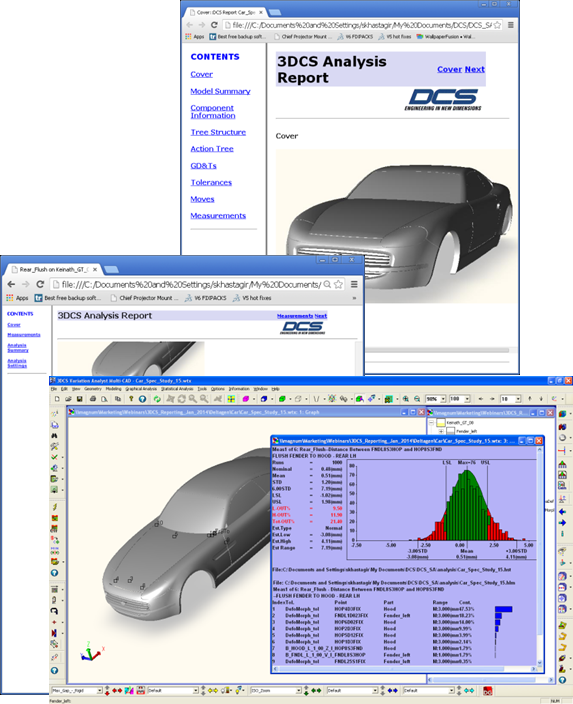
Learn how you can quickly and easy create great looking reports of your analysis, CAD model images and data quickly and efficiently.

One button html reports with all your analysis inputs and outputs? Yeah, we got that.
Can't make it? Register to get the recorded session sent straight to your inbox!

Prefer Excel? Easily share and collaborate your results with colleagues.
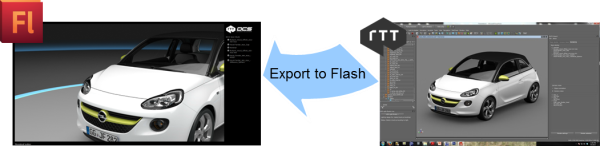
In this webinar, learn how to create fully interactive reports of your variation analysis data and images with the push of a button. Moreso, see how you can export your data in various formats and utilize your other tools to make report creation faster and easier.
With multiple formatting and file options, and many ways to customize your reports, 3DCS reporting is the perfect way to deliver incredible reports and presentations in a fraction of the time.

Looking good as part of a presentation to management. This report took almost a minute to make.

Pick a format, your choice. Use real data from your plants and manufacturing line.
Quickly share visual data and high end visualization studies
Don't forget to register!

North American Innovation Center
28064 Center Oaks Ct A, Wixom, MI 48393
Call us: +1 (248) 504 6200


Comments (1)