
Tolerance Negotiations are never easy. Customers will try to hold their suppliers to difficult or over-engineered tolerances, or simply don't know that certain tolerances can be opened without affecting the assembly quality, or need to be opened (increased) in order to keep costs reasonable.
DCS provides 3 tools to support tolerance negotiation by using data to back up tolerance change requests:
1. Tolerance Negotiator -- QDM Analyst Tool
2. 3DCS Variation Analyst Simulation Results
3. QDM Management Reports
How do I get it?
Tolerance Negotiator is built into the base QDM Analyst software, without the need for add-ons or additional purchases. If you have QDM Analyst, the standalone QDM template maker software, you have Tolerance Negotiator.
Tolerance Negotiator is under the Tools tab of QDM Analyst.
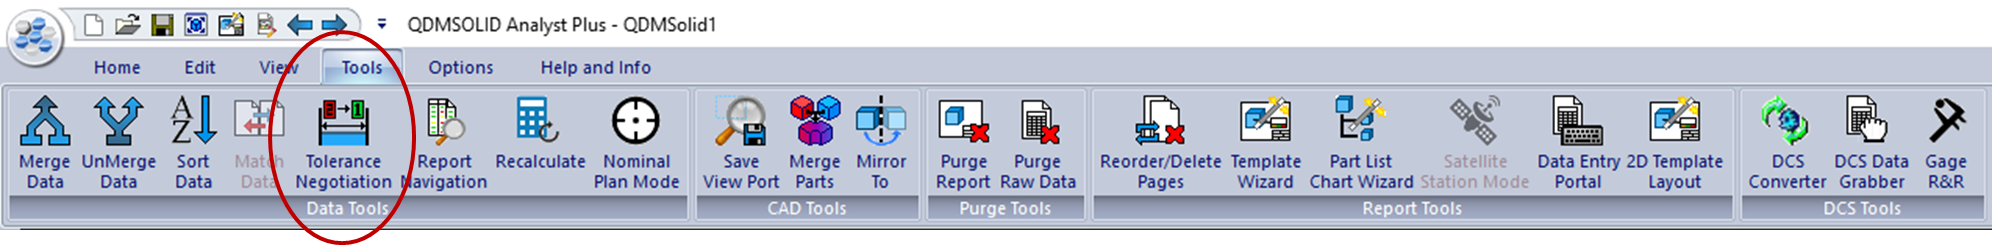
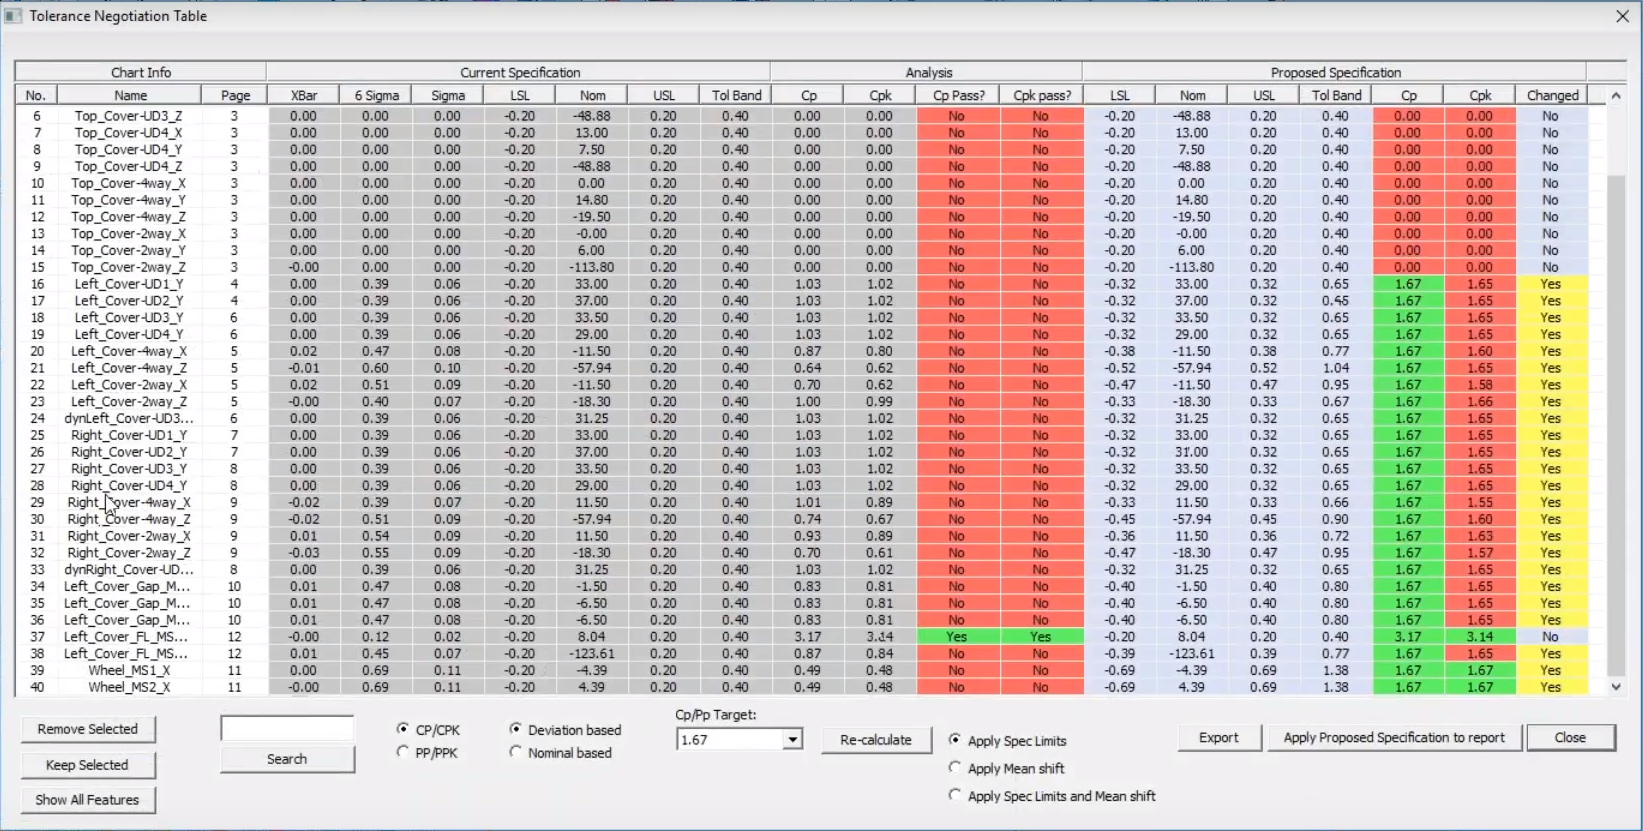
After clicking Tolerance Negotiator, a table with all of the imported data measurements is generated.
Plant and Measured Data can be imported from any inspection device and used to demonstrate production tolerances and metrics. Suppliers use the first 30 parts in a production line, or prototype measurements to demonstrate measured values and whether they are meeting or failing to meet statistical objectives (Pp or Cp).
Simulation data from an analysis tool can also be used before production. As a DCS Software, QDM is already configured to utilize 3DCS data. Importing 3DCS simulation results can show the risk of failure for given objectives.
1. Tolerance changes required to meet given Cp / Pp objectives
2. How Tolerance changes affect Cp and Pp
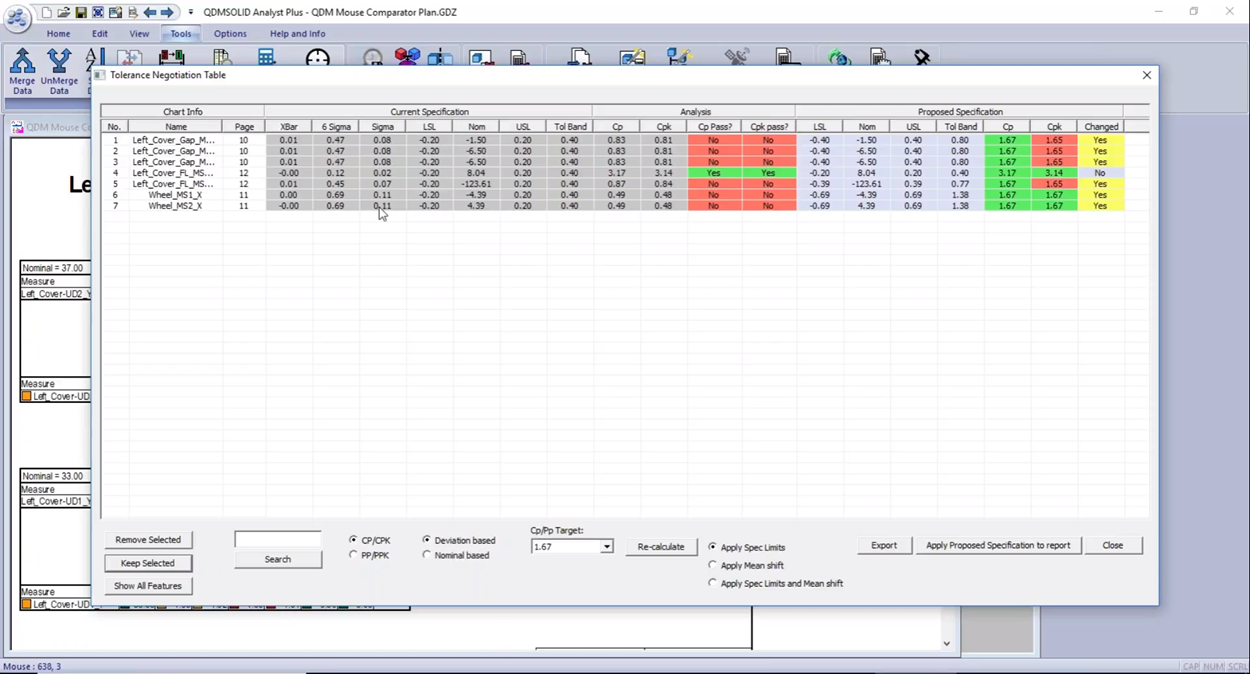
This lets the user change tolerances, values and objectives and instantly see the results. For example, if your customer gave a required Pp of 1.33, you can show which tolerances in the provided design can actually meet that objective. With 3DCS, you can demonstrate how 3D stack ups affect those tolerances and further determine the final Pp or Cp values, and may affect the final range of variation.
The video below demonstrates how the use of Tolerance Negotiator:
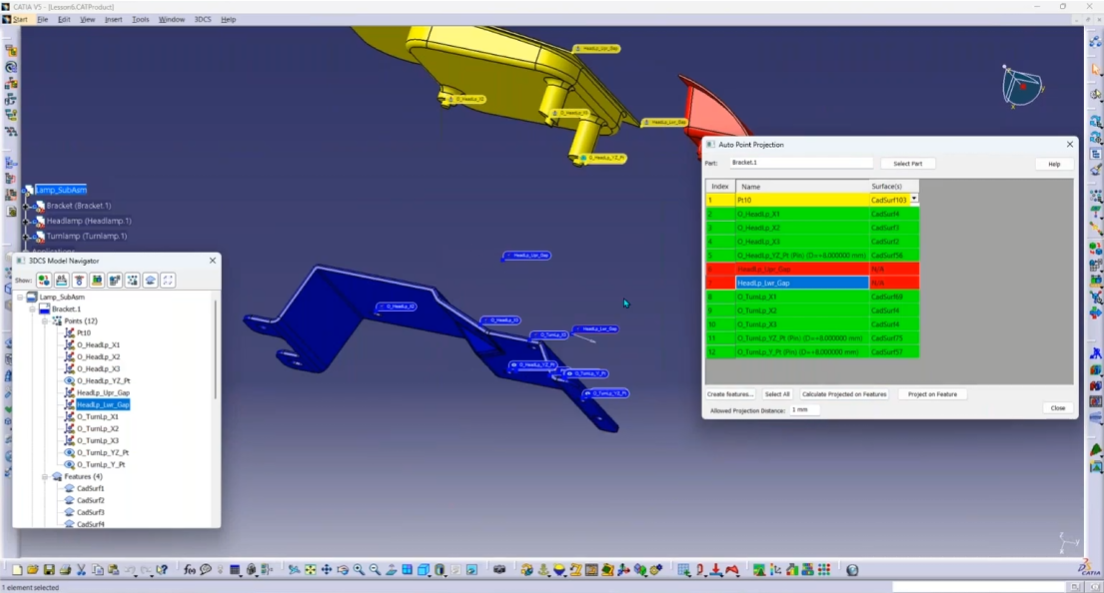
3DCS Variation Analyst simulates assembly builds across a normal distribution (default) using Monte Carlo Simulation. Incorporating part tolerances and assembly processes, 3DCS provides outputs of simulated measurements that include the 3 dimensional variation stack of all parts and processes in the model.
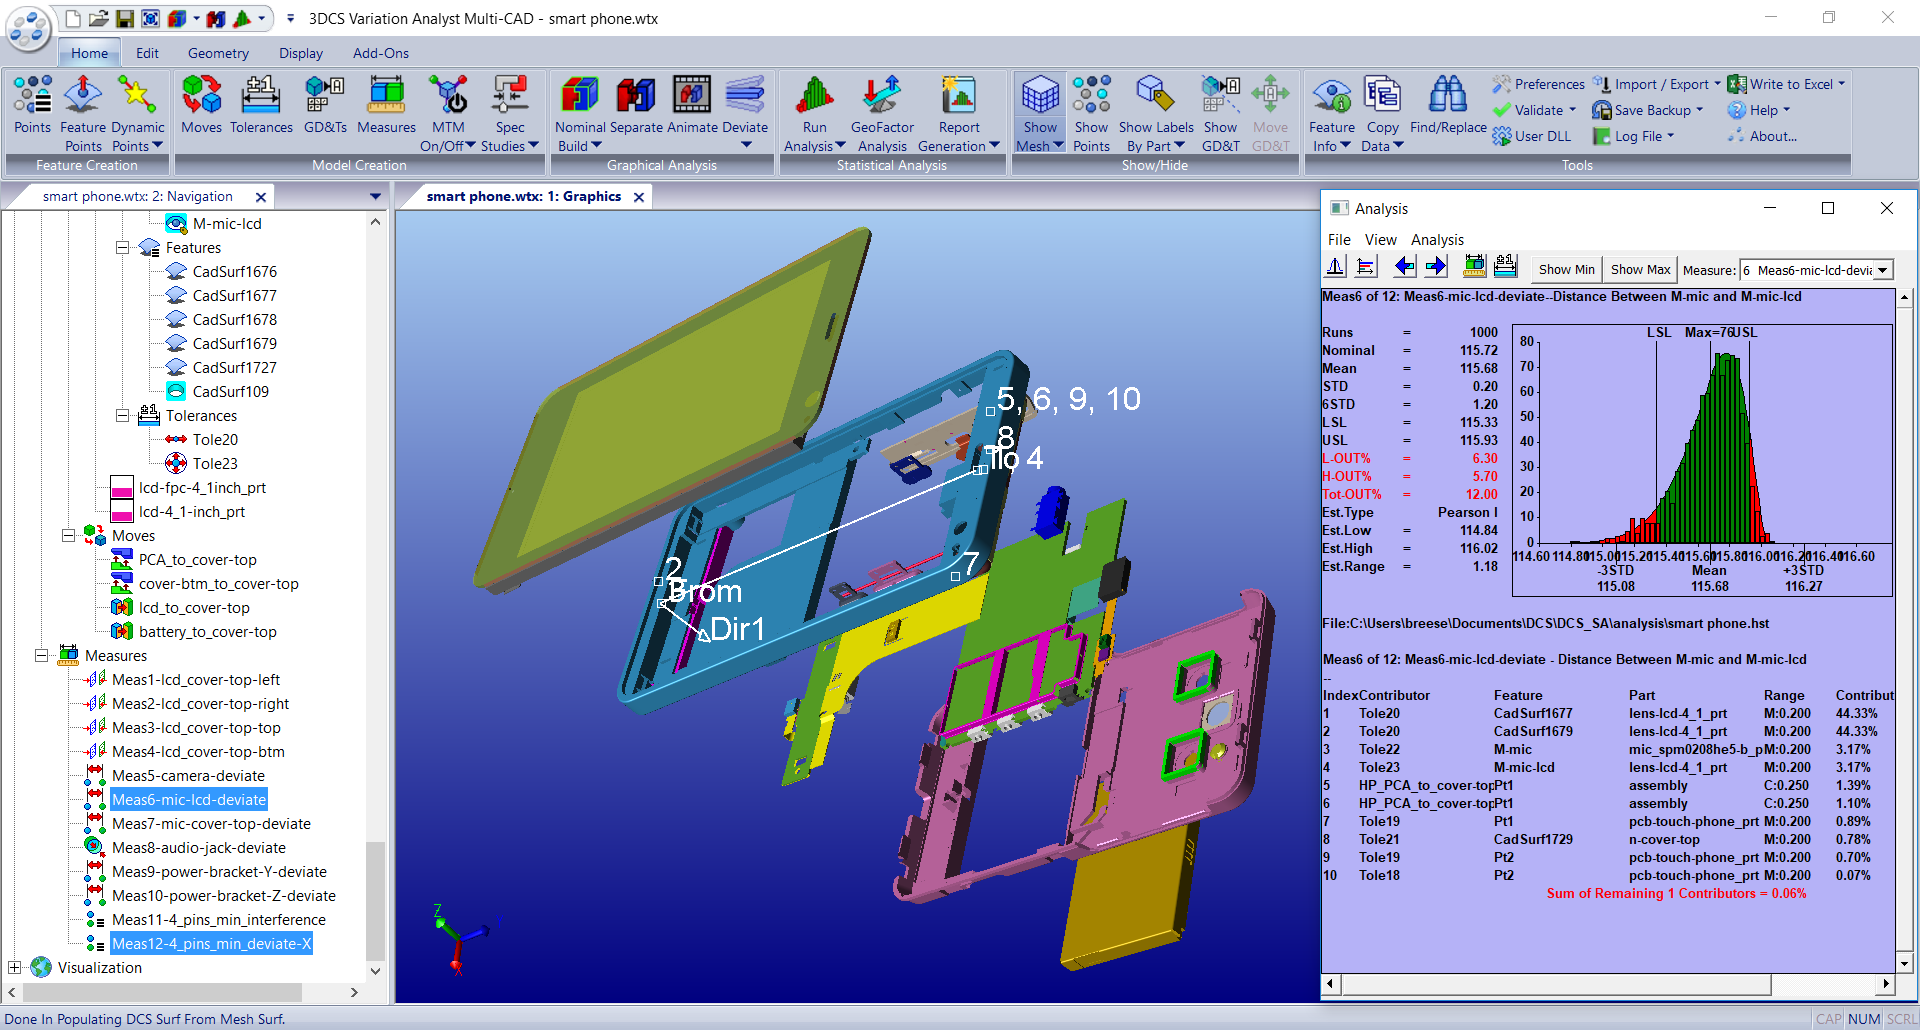
The results are the measured results of hundreds or thousands of virtual product builds compiled and analyzed statistically. Beneath the simulation results are the sensitivity results, which include the largest contributing tolerances to the given measure.
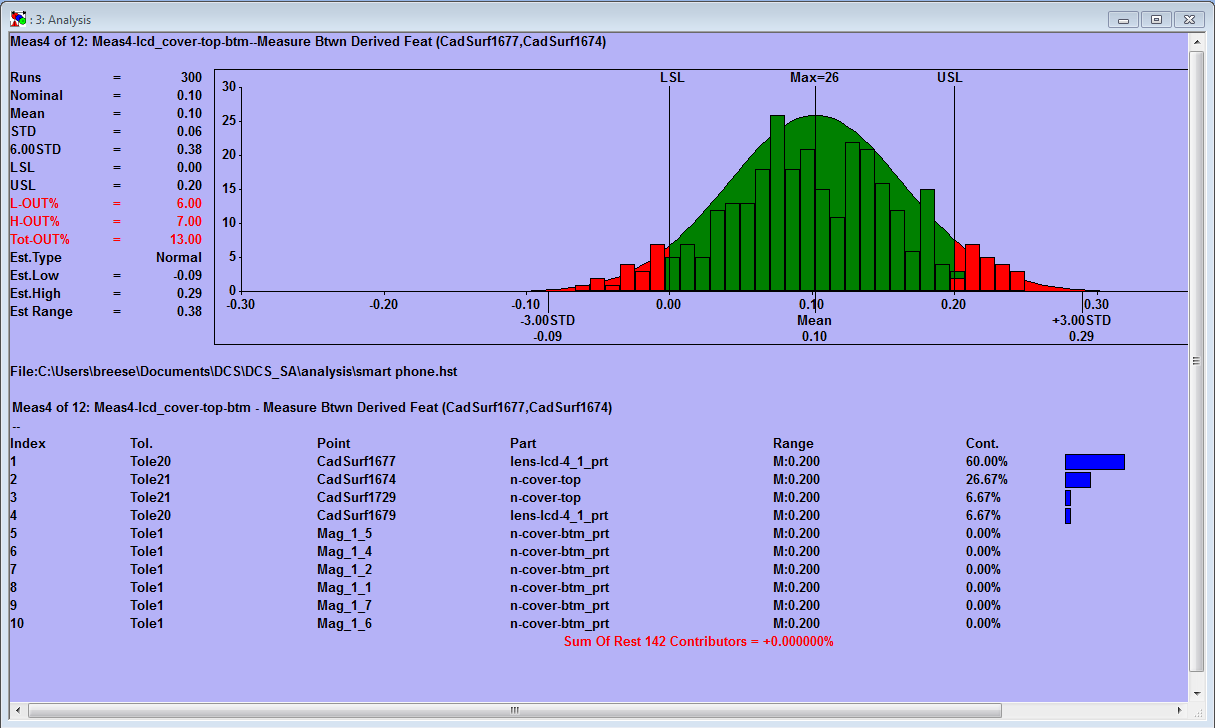
In the simulation results window, upper and lower specification limits can be dragged to adjust and see the statistical outputs, Cp and Pp, change accordingly. It also demonstrates the expected failure rate for each given measurement with its given specification limits. This information can be valuable in showing the risk of build failure for each feature based on current design specifications, and how changes can affect either the Cp/Pp or the risk of failure. Adjusting a tolerance and re-running the analysis can show the change to the simulation results and whether an adjustment will positively or negatively affect the model outputs.
Here is a video example of one method of how 3DCS simulation results can be used for tolerance negotiation:
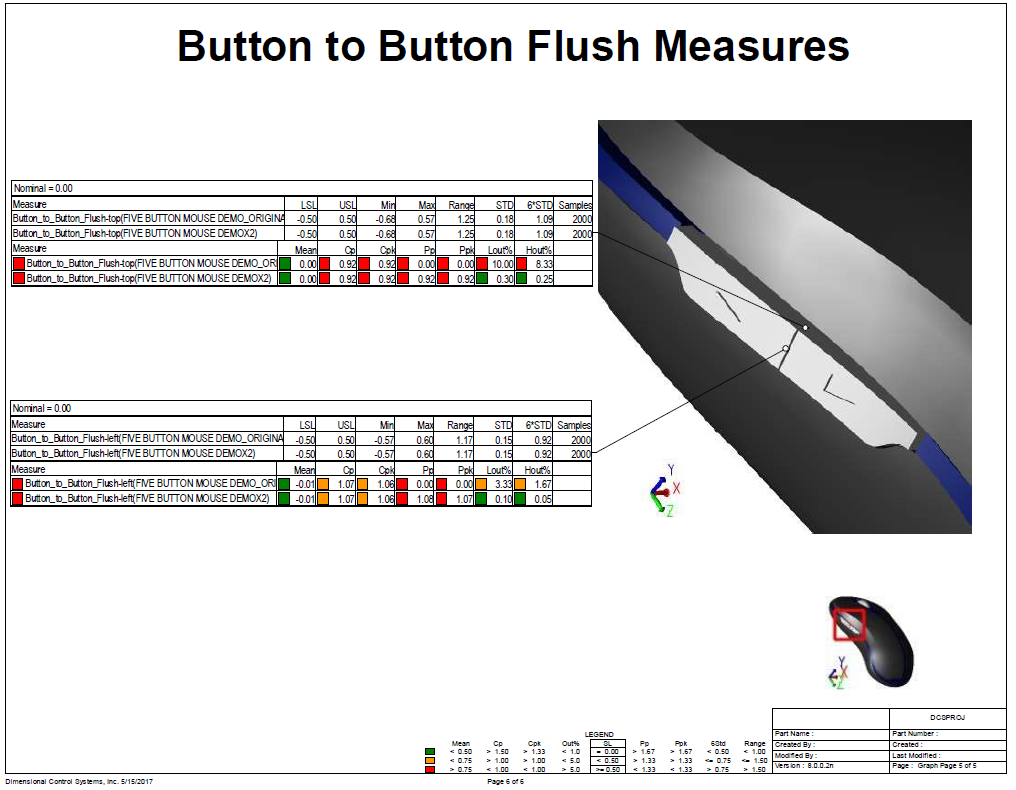
QDM Management Reports are an effective way to present results to managers and business leaders. They summarize and display simulation or production results, giving visual context and information to make it easy to understand the content.
Within the reports, as part of tolerance negotiation, a user can set specification limits or pass/fail criteria and color coding to show whether given measurements passed or failed inspection.
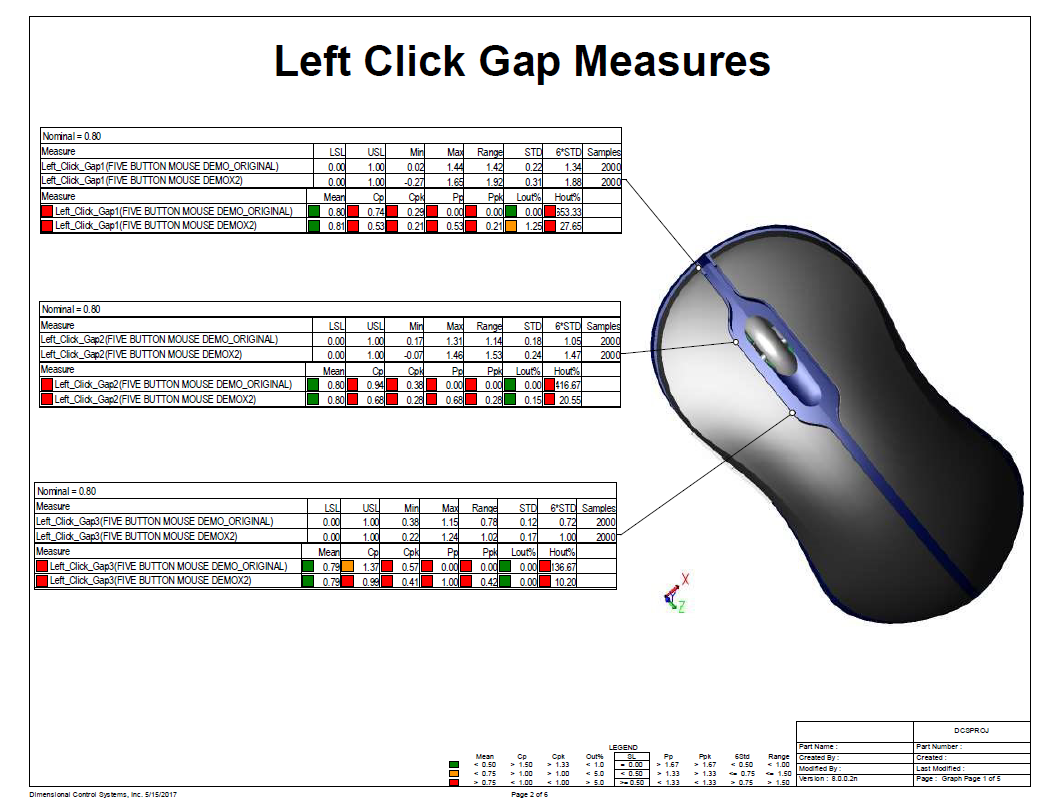
This is a good way to show simulation results from 3DCS or production data in QDM and whether those simulation results will meet quality expectations. It can be helpful for pointing out trouble areas and leading into a tolerance negotiation on resolutions for those given measurements and tolerances.

North American Innovation Center
28064 Center Oaks Ct A, Wixom, MI 48393
Call us: +1 (248) 504 6200


No Comments Yet
Let us know what you think