This excerpt is taken from the 2021 DCS Global Technology Conference presentation by Spencer Strouse, and available On-Demand here: https://mkt.3dcs.com/dcsgtc-request-registration-on-demand-2021
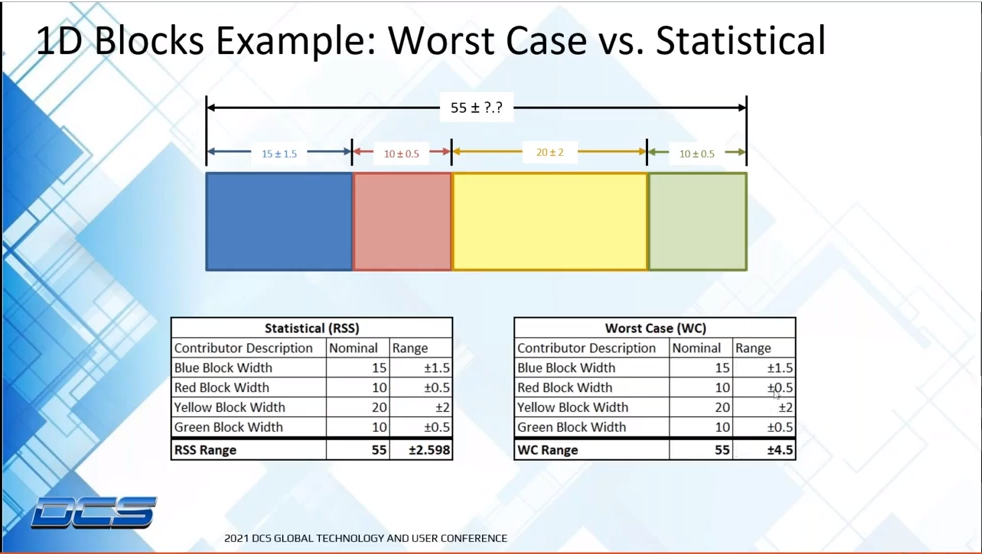
When performing a WC analysis, we are checking the worst possible result for a specific measure given the parts we are deeming as “acceptable” per the GD&T or linear dimensions on the individual part drawings. For example, if we stack up four blocks, then each block as its own height and a tolerance on that height. If each of the four blocks comes in at the tallest allowable height then we would get an assembly of our four blocks with its WC maximum height. There is obviously also the inverse of short blocks which will yield the WC minimum height.

Block1 Tol: ±1
Block2 Tol: ±2
Block3 Tol: ±1
Block4 Tol: ±0.5
WC Max = 1+2+1+0.5= +4.5
WC Min = -1-2-1-0.5= -4.5
WC Range = ±4.5
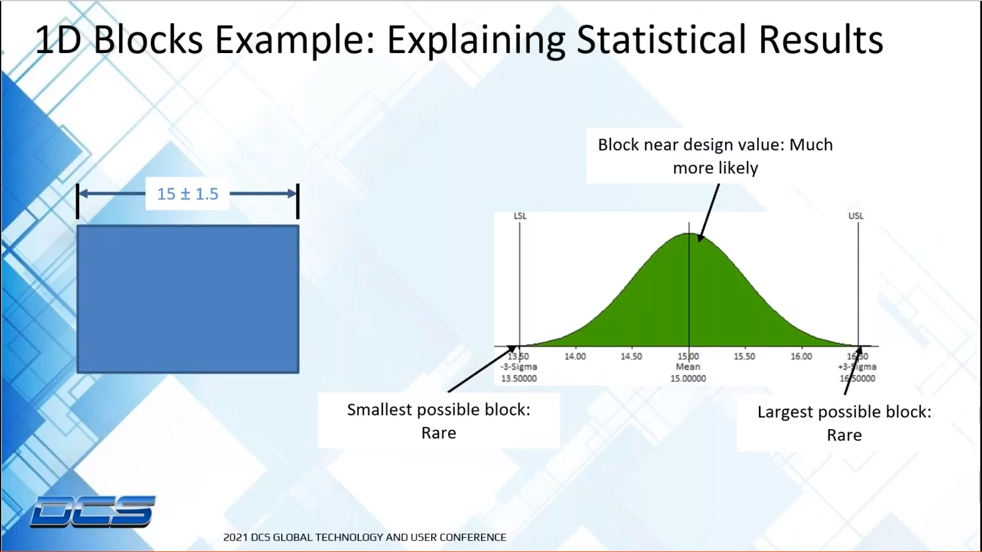
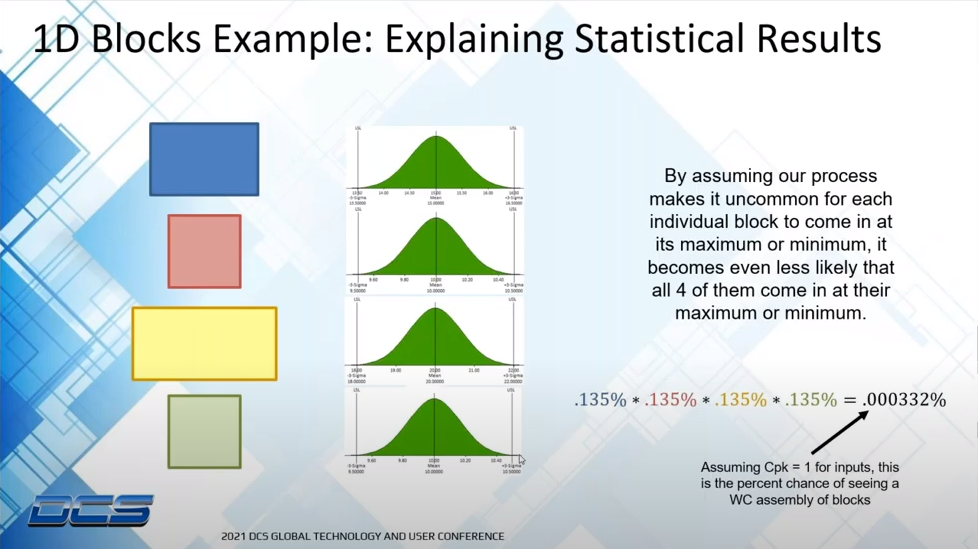
While preparing our design to handle the results we get from a WC analysis protects us from any possible problem (assuming all parts within the assembly are within the acceptable limits of course), it is also potentially overly cautious because of the improbability that a WC assembly occurs. This is where our RSS results come into play. If we assume a process capability of Cpk = 1 for the block example used above, it means there is ~0.135% chance of any individual block being at its maximum (or minimum) value. That means the odds of all four blocks being at their maximum (or minimum) value is ~0.00033%. As an engineer it is our job to balance cost and risk. In this case the risk of the blocks reaching the WC values is very unlikely so it might be cheaper to put in a plan in place to accommodate the occasional occurrence of a “bad assembly.” However, we do still need to know what our likely range of assembly heights is going to be. We’ll use the standard Root Sum Square formula for combining Normal Distributions:
RSS Max = (12+22+12+0.52)= +2.5
RSS Min = -(12+22+12+0.52)= -2.5
RSS Range = ±2.5
As expected the RSS Range is substantially lower than the WC Range. The RSS Range represents a statistically likely range of outcomes. To be precise, based on our input assumptions of Cpk = 1 for our four blocks, we can say that 99.73% of samples will fall within the boundaries of our RSS Range.
Now, just because it is statistically very unlikely to see a WC in our assemblies, it doesn’t always mean we should ignore these numbers. The question we have to ask ourselves when considering WC or RSS for our design consideration is: what happens if we get an unacceptable assembly? If it is just an aesthetic feature then probably we are okay to only design with the RSS Range in mind. If it is something with a much more dire consequence then WC may need to be considered. Some situations where WC may be important:
In summary, WC and RSS numbers both have their place in the engineering design process. It is the duty of the engineer to understand the risks and costs associated with each one.

Click to Get Access to the On-Demand Event

North American Innovation Center
28064 Center Oaks Ct A, Wixom, MI 48393
Call us: +1 (248) 504 6200


No Comments Yet
Let us know what you think