 In the next part of the Version 7.5 series, learn how to utilize your 3DCS model to accomplish a number of tasks and downstream applications such as:
These are just some of the applications for a completed 3DCS model. Join the webinar to see all of these and learn about more -
Thu, Mar 22, 2018 11:00 AM - 12:00 PM EDT
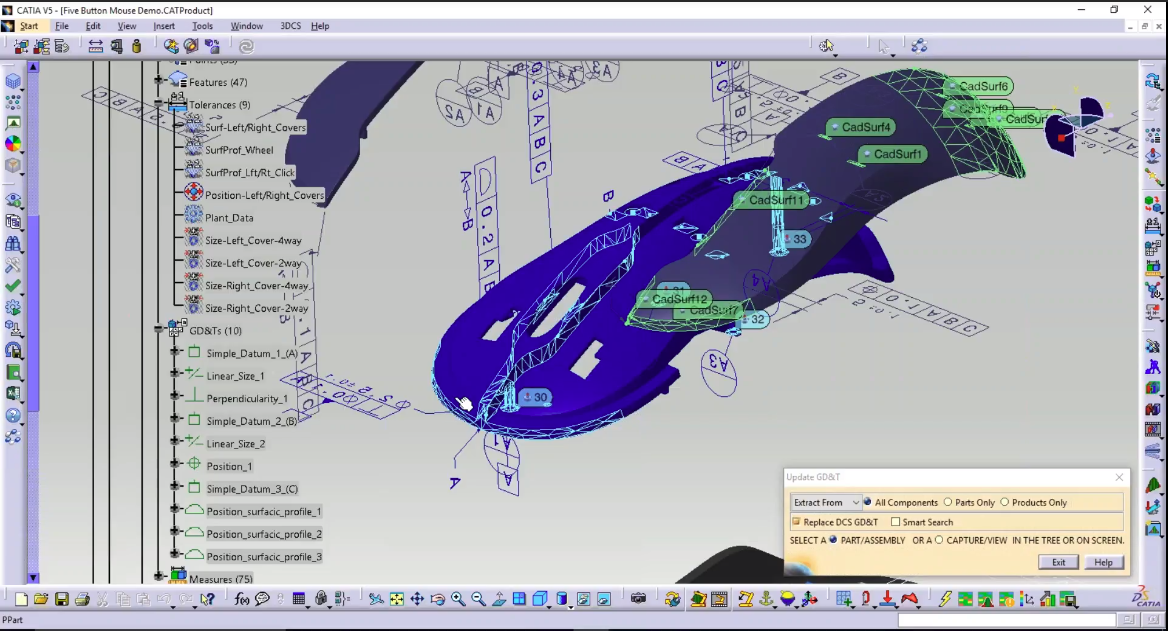
Version 7.5 brings new applications of 3DCS to supply your manufacturing teams with measurement plans. These plans correlate measurement points to your CAD points allowing for fast uploading of measurement data and powerful problem solving and validation in your 3DCS model.
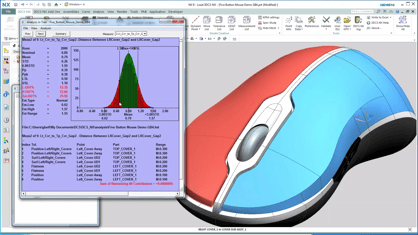
What's more, this same process supports the creation of management reports, slimmed down reports that focus on metrics and quality callouts that are easy to read, use and communicate to stakeholders and project leaders. Additionally, these same tools can give you powerful evidence to negotiate tolerances with suppliers or customers to improve quality.
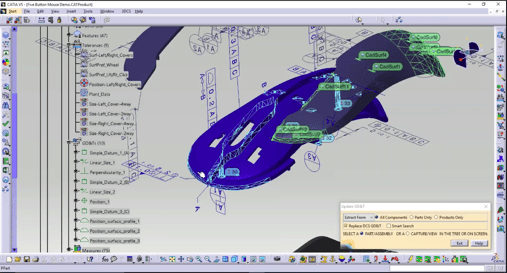 Once you complete a 3DCS and CAD analysis, and have used it to optimize and validate your model, you need to share those results across the organization in a meaningful way. To help you share with managers, you can create Management Reports from your 3DCS model.
In addition, to utilize all the work and effort your team put into the model, you can generate measurement plans and CMM routines from the CAD data for inspection teams in production.
3DCS can generate automated reports with the push of a button. These reports are excellent for collaborating with engineering teams and dimensional modelers. However, these reports tend to be technical in nature, and can be quite large. Showing your results to managers and directors using technical outputs can be difficult. To simplify this process, many engineers create management reports by hand, collecting images and statistics and summarizing key findings and outputs. This can take a lot of valuable time; time better spent elsewhere.
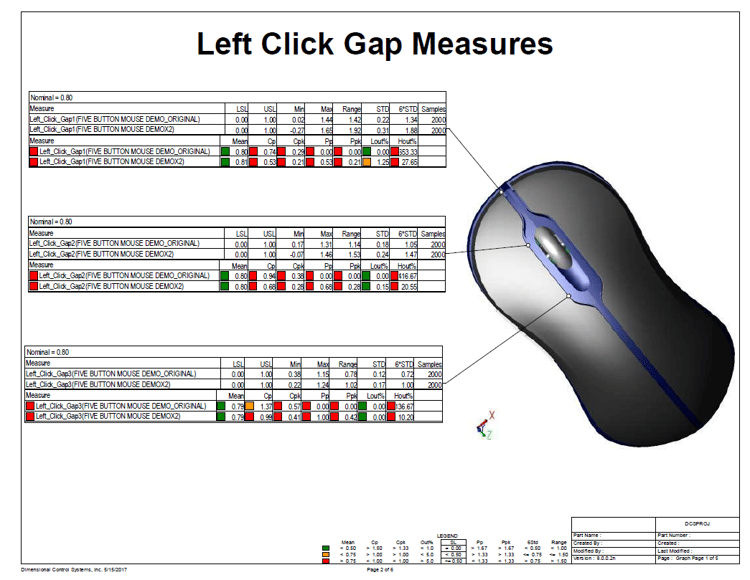
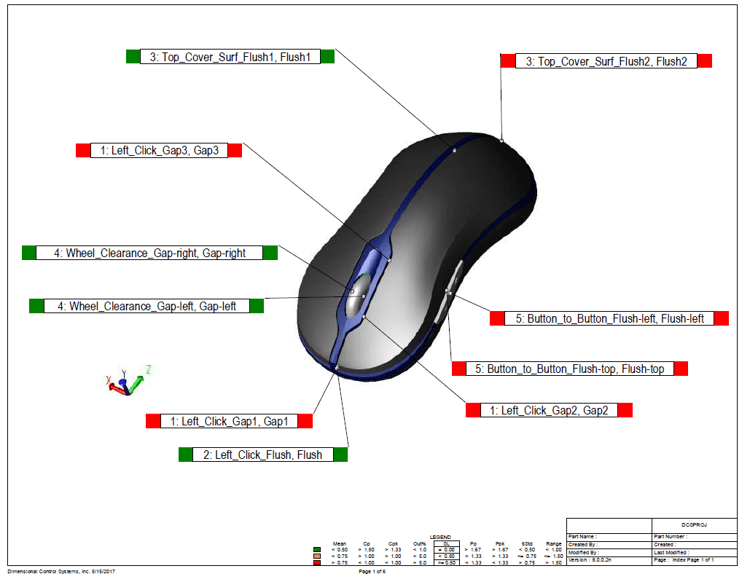
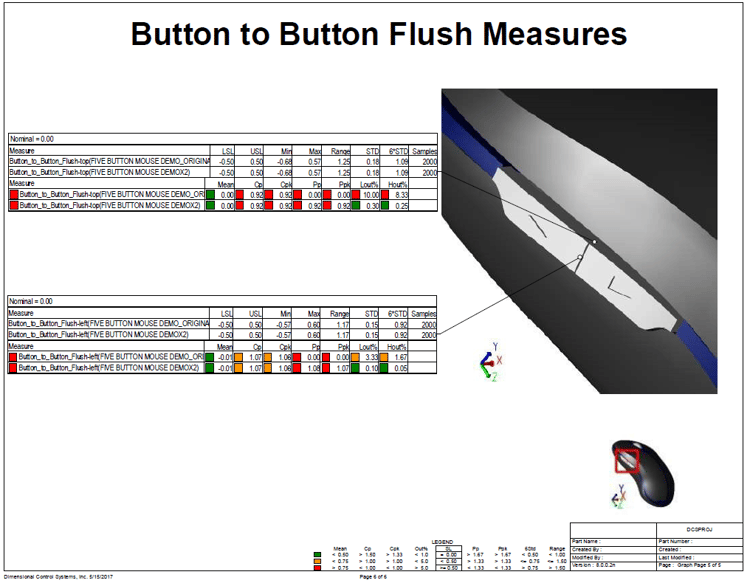
Using 3DCS, engineers can create Management Reports with a few button clicks. These reports use the CAD model to highlight key features, and instantly calculate your SPC metrics, color coding the findings based on your specifications. These reports are then easy to share and present, saving a lot of time that would have been spent crunching statistics, copying and pasting images and drawing leader lines.
Utilizing the same process, you can quickly create Measurement Plans with easy to follow callouts and coordinates that can be shared with inspection teams and measurement labs. These allow you to find critical features with 3DCS, and then make sure those features are being measured in production.
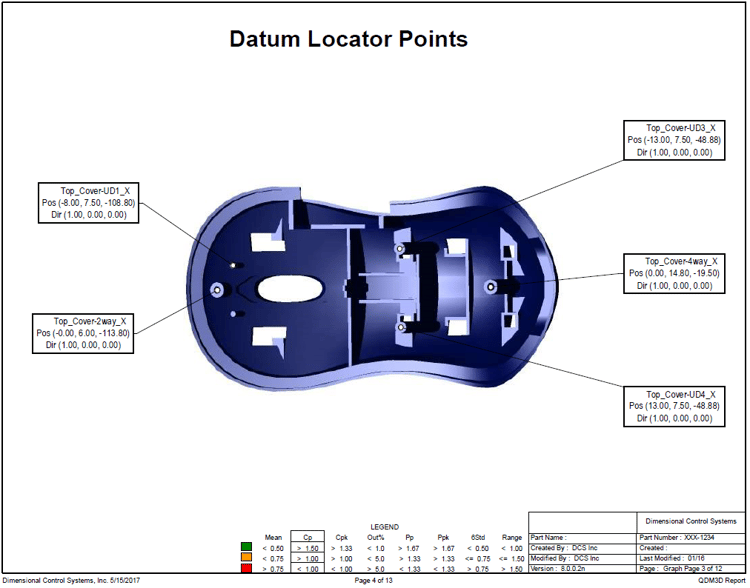
You can also export CMM routines to program into your CMM to measure the critical features of your parts.
Suppliers measuring where they want, how they want? Does this force you to measure all supplier parts once they arrive to check for non-conformances?
Sharing CAD based Measurement Plans and CMM Routines can align your suppliers to your inspection plans, making their data relevant and easy to verify. This can greatly improve your supplier quality process, as your suppliers begin to measure where you want and how you want with clear directions and plans. Use your SPC system to instantly analyze their results and give you complete quality reports before your supplier ships a single part. In this way, you can catch non-conformances and issues before the parts leave your supplier, making it far easier to resolve these issues and verify that you are receiving the parts you need, within your specifications.
Tolerance Negotiator is a built-in tool to QDM Analyst, which is an inexpensive add-on to 3DCS, or a stand alone SPC tool. Tolerance Negotiator makes communicating tolerances with customers and suppliers easy, and with the results from a 3DCS study, gives you the evidence you need to prove whether a tolerance should be tightened or loosened.
So how did your simulation results hold up to actual production parts?
Don't guess, find out!
Using comparator charts, you can quickly take a 3DCS output and a measurement output (using the above measurement plan), and create a comparator chart to tell you just how the two match up. That would take a while, wouldn't it? With QDM Analyst, its a couple button clicks and almost 20 seconds of letting the software crunch, and it is in your hands.
Use the same process to create other reports. Compare between suppliers, or before and after changing out a machine. Take all of your measured data and put it into a single report to show the entire production process in one place. The options are limitless.
Now that you have used your measurement plan to gather some inspection data, you can import that data into your CAD model. Use this to solve production issues, root cause manufacturing problems and design out non-conformances. Make adjustments for mean shifts and last minute design changes. Continually improve your design and feed it back into production, then store your data to give the next project a strong quality foundation.
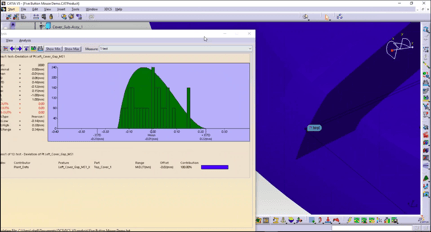
See how to accomplish these feats in next week's webinar.
You do a lot of work on the CAD model, so why not take advantage of your hard work to push quality improvement throughout the entire product life cycle?
Join us next week for live demo's and how-to's with -
Thu, Mar 22, 2018 11:00 AM - 12:00 PM EDT
These Stories on 3DCS
No Comments Yet
Let us know what you think