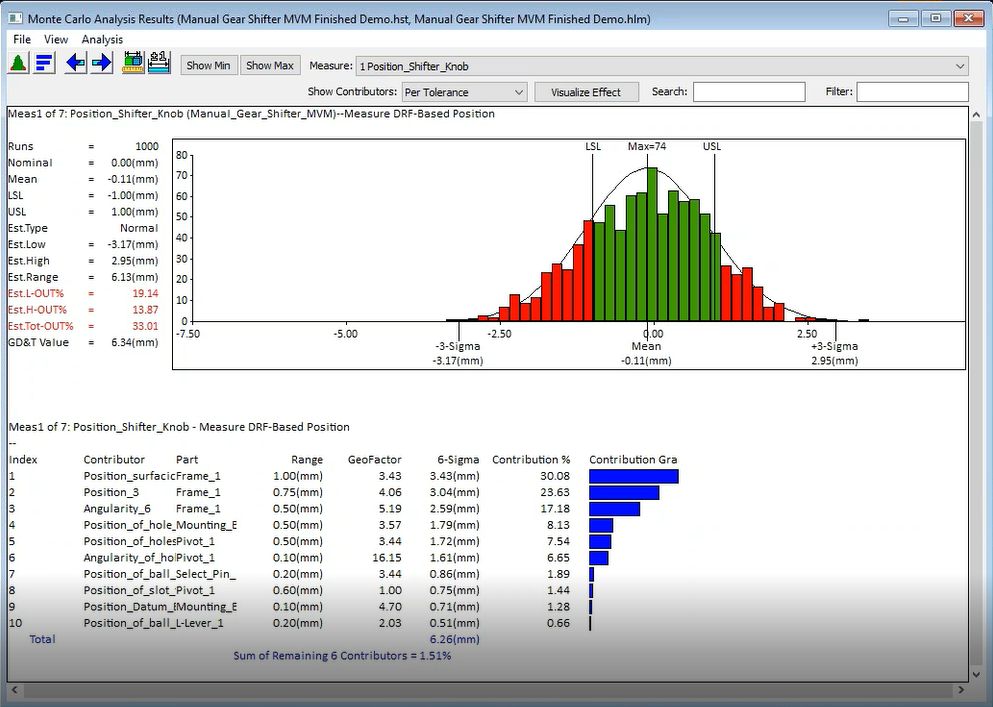
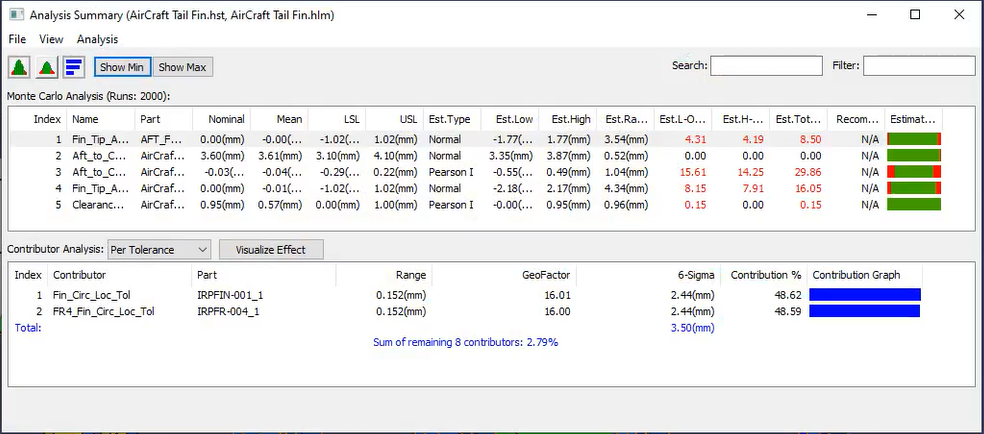
The development team has made a lot of changes to the results display: Updated the Analysis window result page to display the results in a Table view, moved GeoFactor to the results page as its own results called GeoFactor Analysis and added GeoFactor to the Contributor Analysis results.
Monte Carlo Analysis
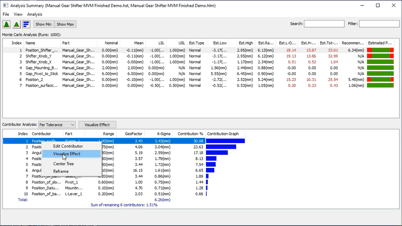
DCS has added a new statistic: Recommended GD&T Value. This value can be used when comparing the 3DCS model output to GD&T drawings.
GeoFactor Analysis
The GeoFactor Analysis has been moved to the same dialog as the Monte Carlo Analysis. GeoFactor Analysis shows the results based on the tolerance range limits instead of a Gradient Step.
Contributor Analysis
Previously called Sensitivity Analysis, DCS has changed Contributor Analysis to use the GeoFactor algorithm. Each tolerance will now be set to their Median, rather their nominal.
GD&T Measure Creation
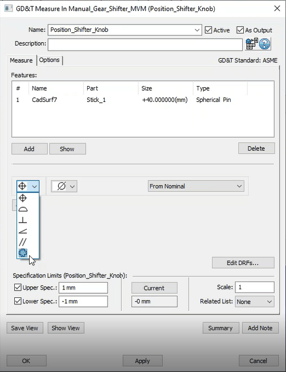
Create measures based on CAD Assembly GD&T. Users can extract Assembly GD&T, defined in the CAD system, as complete Measures in 3DCS.
These new type of measures will check the features, holes, or pins deviation, defined by their datums.
With this addition, users who have their model's PMI / GD&T and Constraints defined in their model can extract a nearly complete model from their CAD, saving valuable modeling time. This becomes especially true on large models.
GD&T Checker and Relationship Wizard
The new GD&T Checker and Relationship Wizard is a tree and validation dialog for validating Features and Points that are used in/with other Moves, Tolerances, Measures (MTM's), Features and Points. The GD&T Checker checks each generated or 3DCS defined GD&T for Syntax, DRF, zone type and surface type. This tool has been long asked for to validate your defined GD&T and help new users apply GD&T to their model.
Feature Groups
Organize sets of Features and MTM data into different groups. Groups will allow users to add organization to their 3DCS tree; move 3DCS features into related groups, and reduce large model tree structures.
Visualize Effect
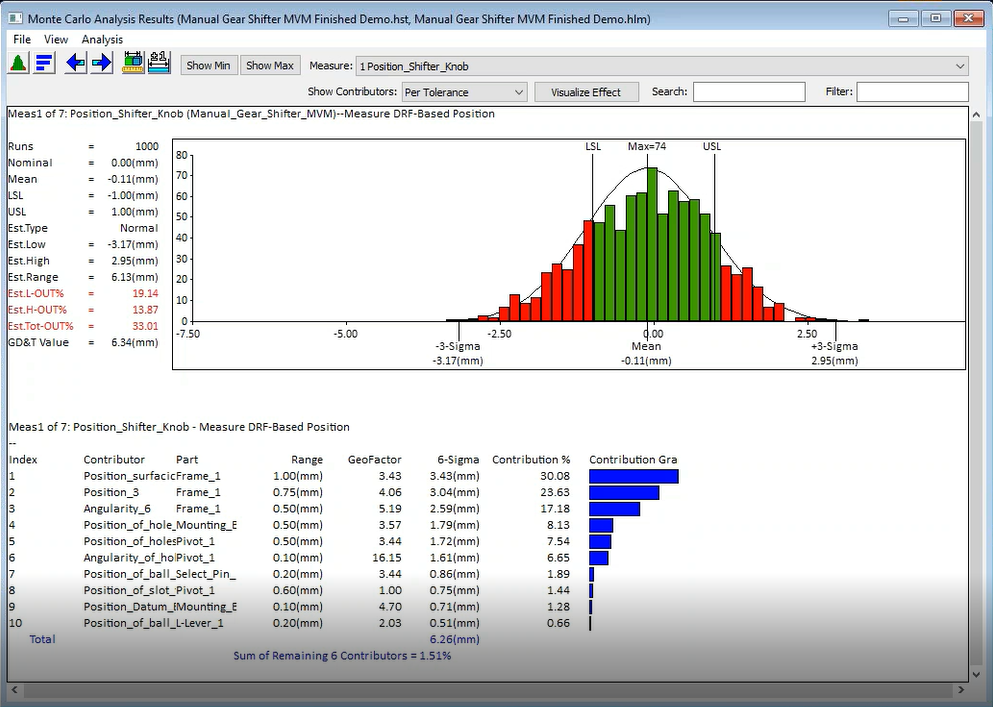
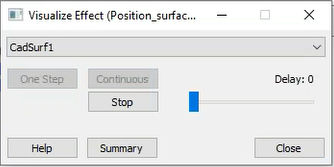
The new Visualize Effect tool allows users to graphically see the impact of a single tolerance or float in the model. This let's users isolate specific tolerances and quickly view their impact on the assembly, as well as being a helpful display tool for showing managers and teams how individual tolerances are affecting the assembly. You can see where it has been added in the dialogues below.
See all these features live next week!
Register for the 2020 Webinar Series to be included in this Special Event and receive the recorded session the day after the live broadcast
These Stories on CATIA
No Comments Yet
Let us know what you think