Join Metrologic, CENIT, and DCS from the Control Messe Show
WEBINAR EVENT
Shopfloor Quality 360 - See MBD through Design, Simulation, Measurement, and Reporting
Thurs, May 25th, 11 am EST
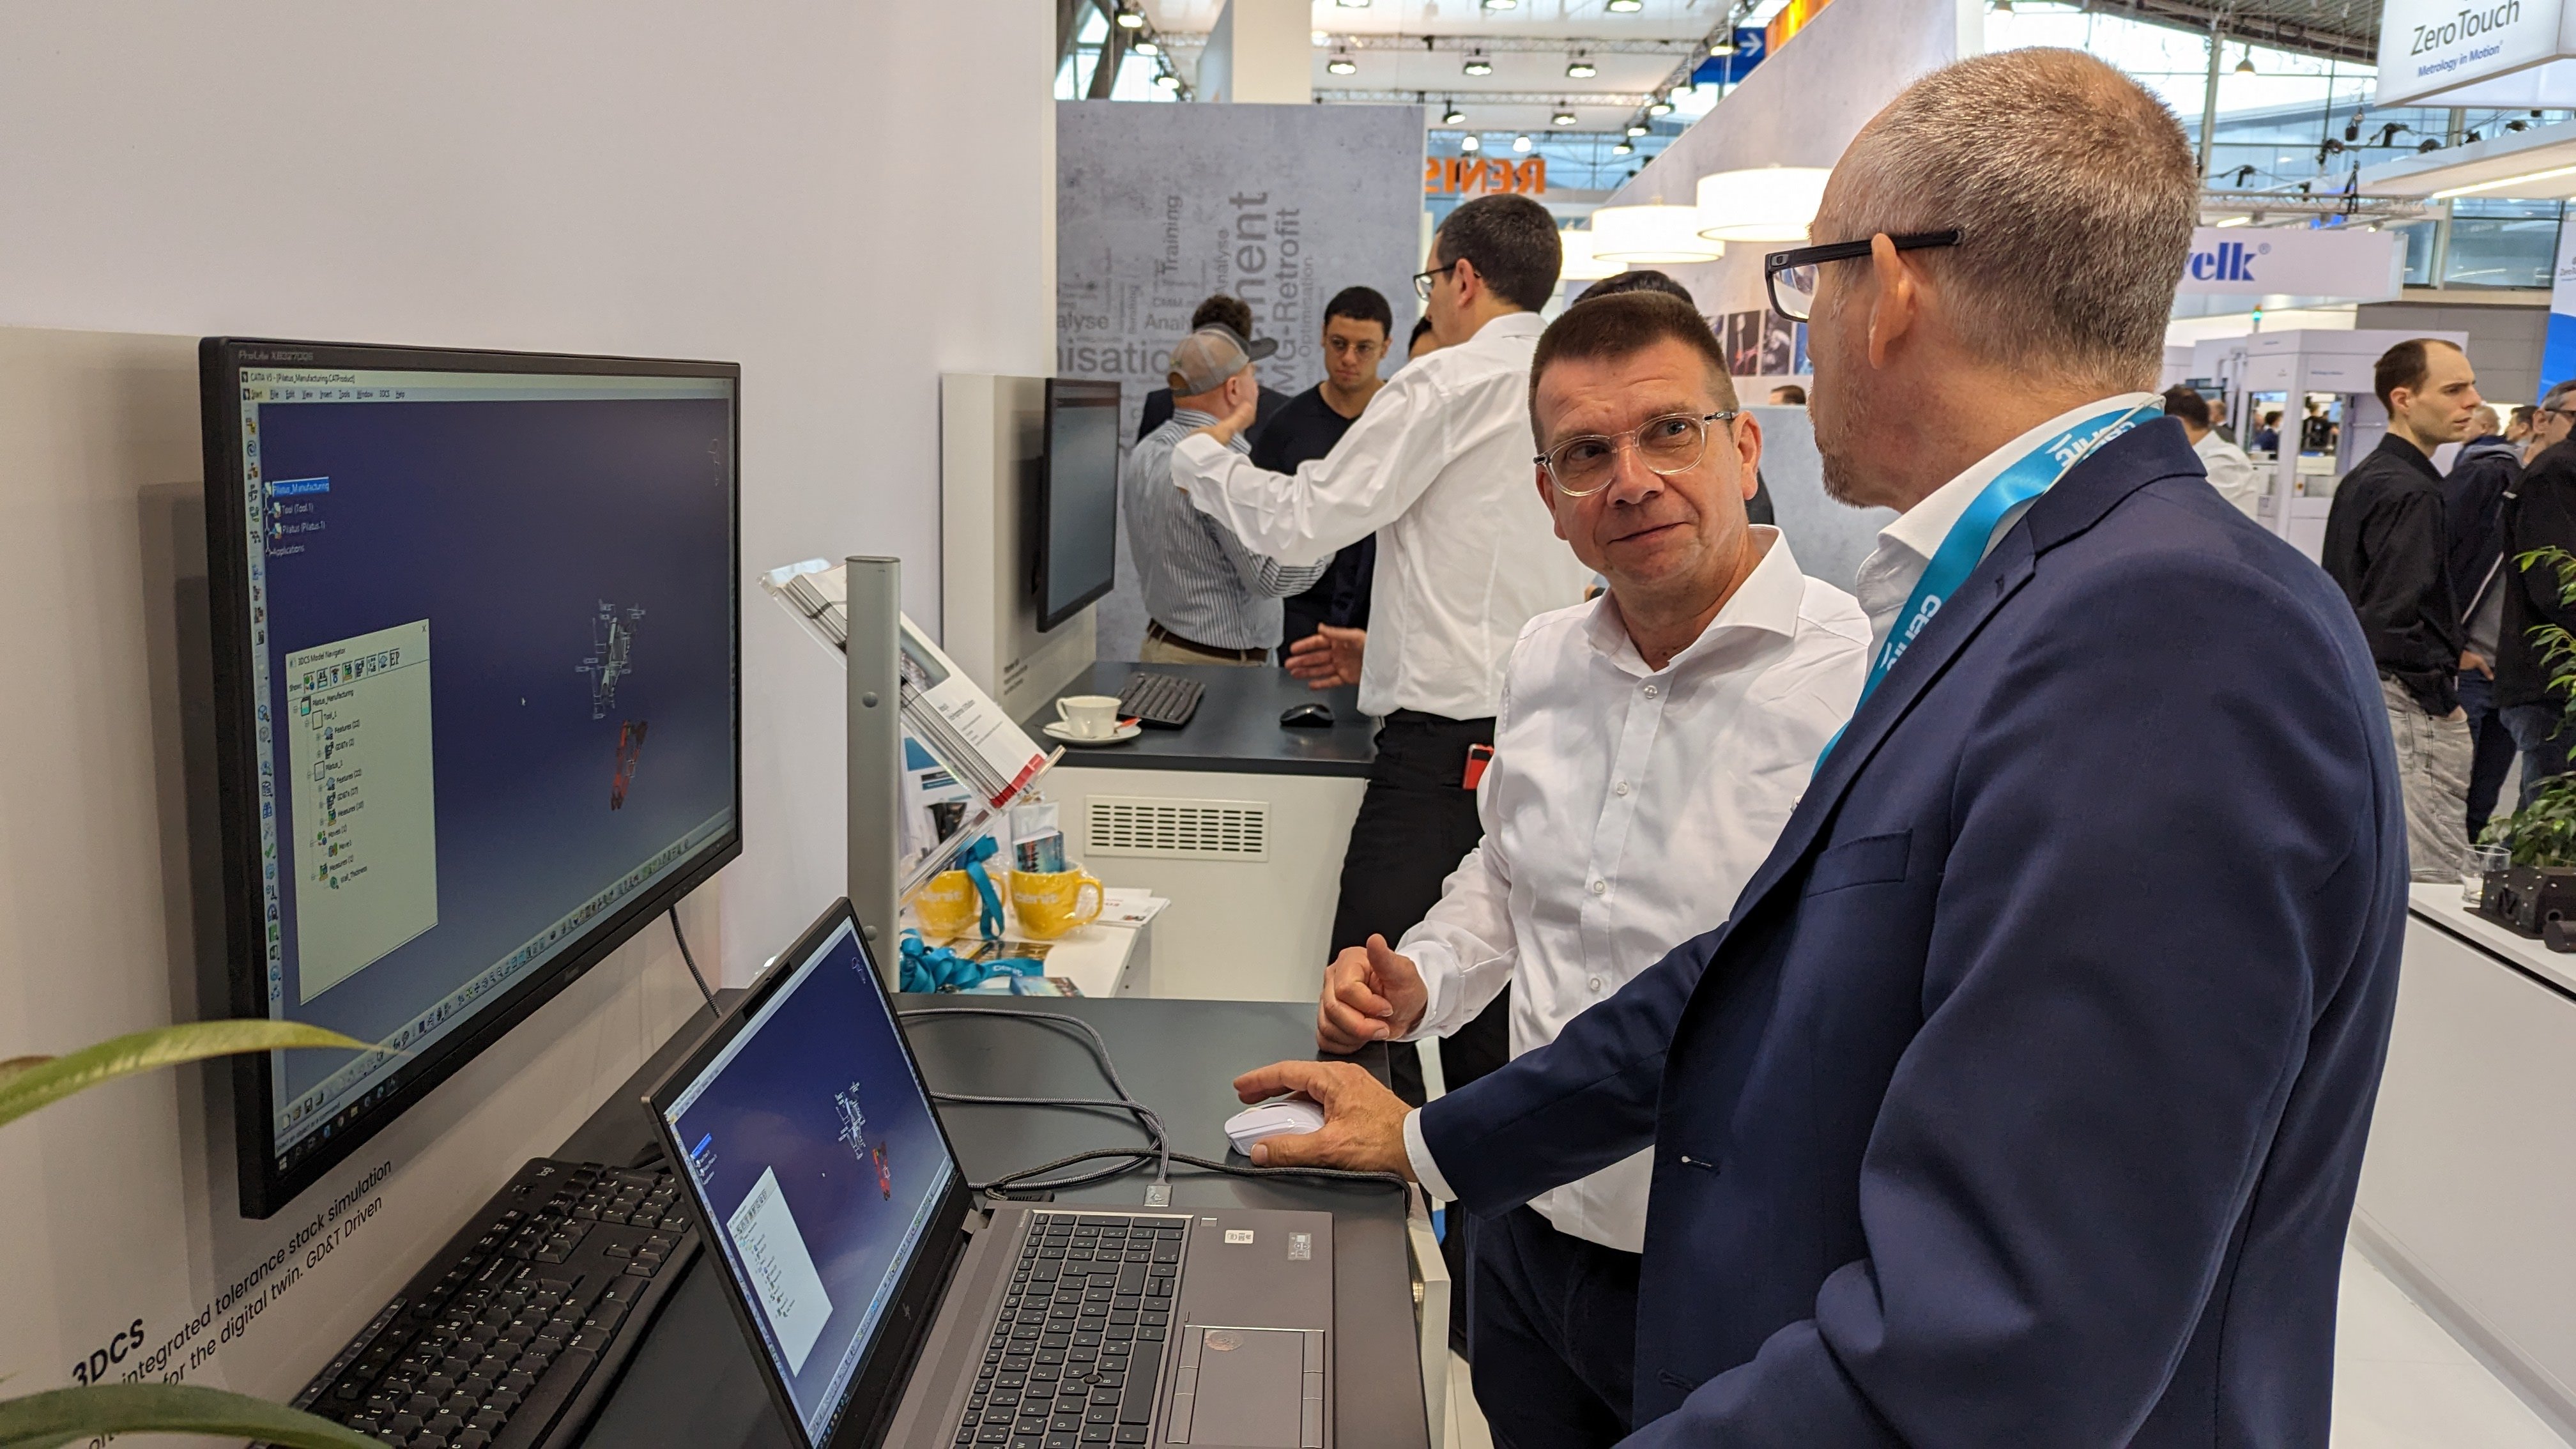
Join CENIT, DCS, and the team from Metrologic on the show floor to see firsthand how your CAD model informs the entire digital thread through each element of PLM.

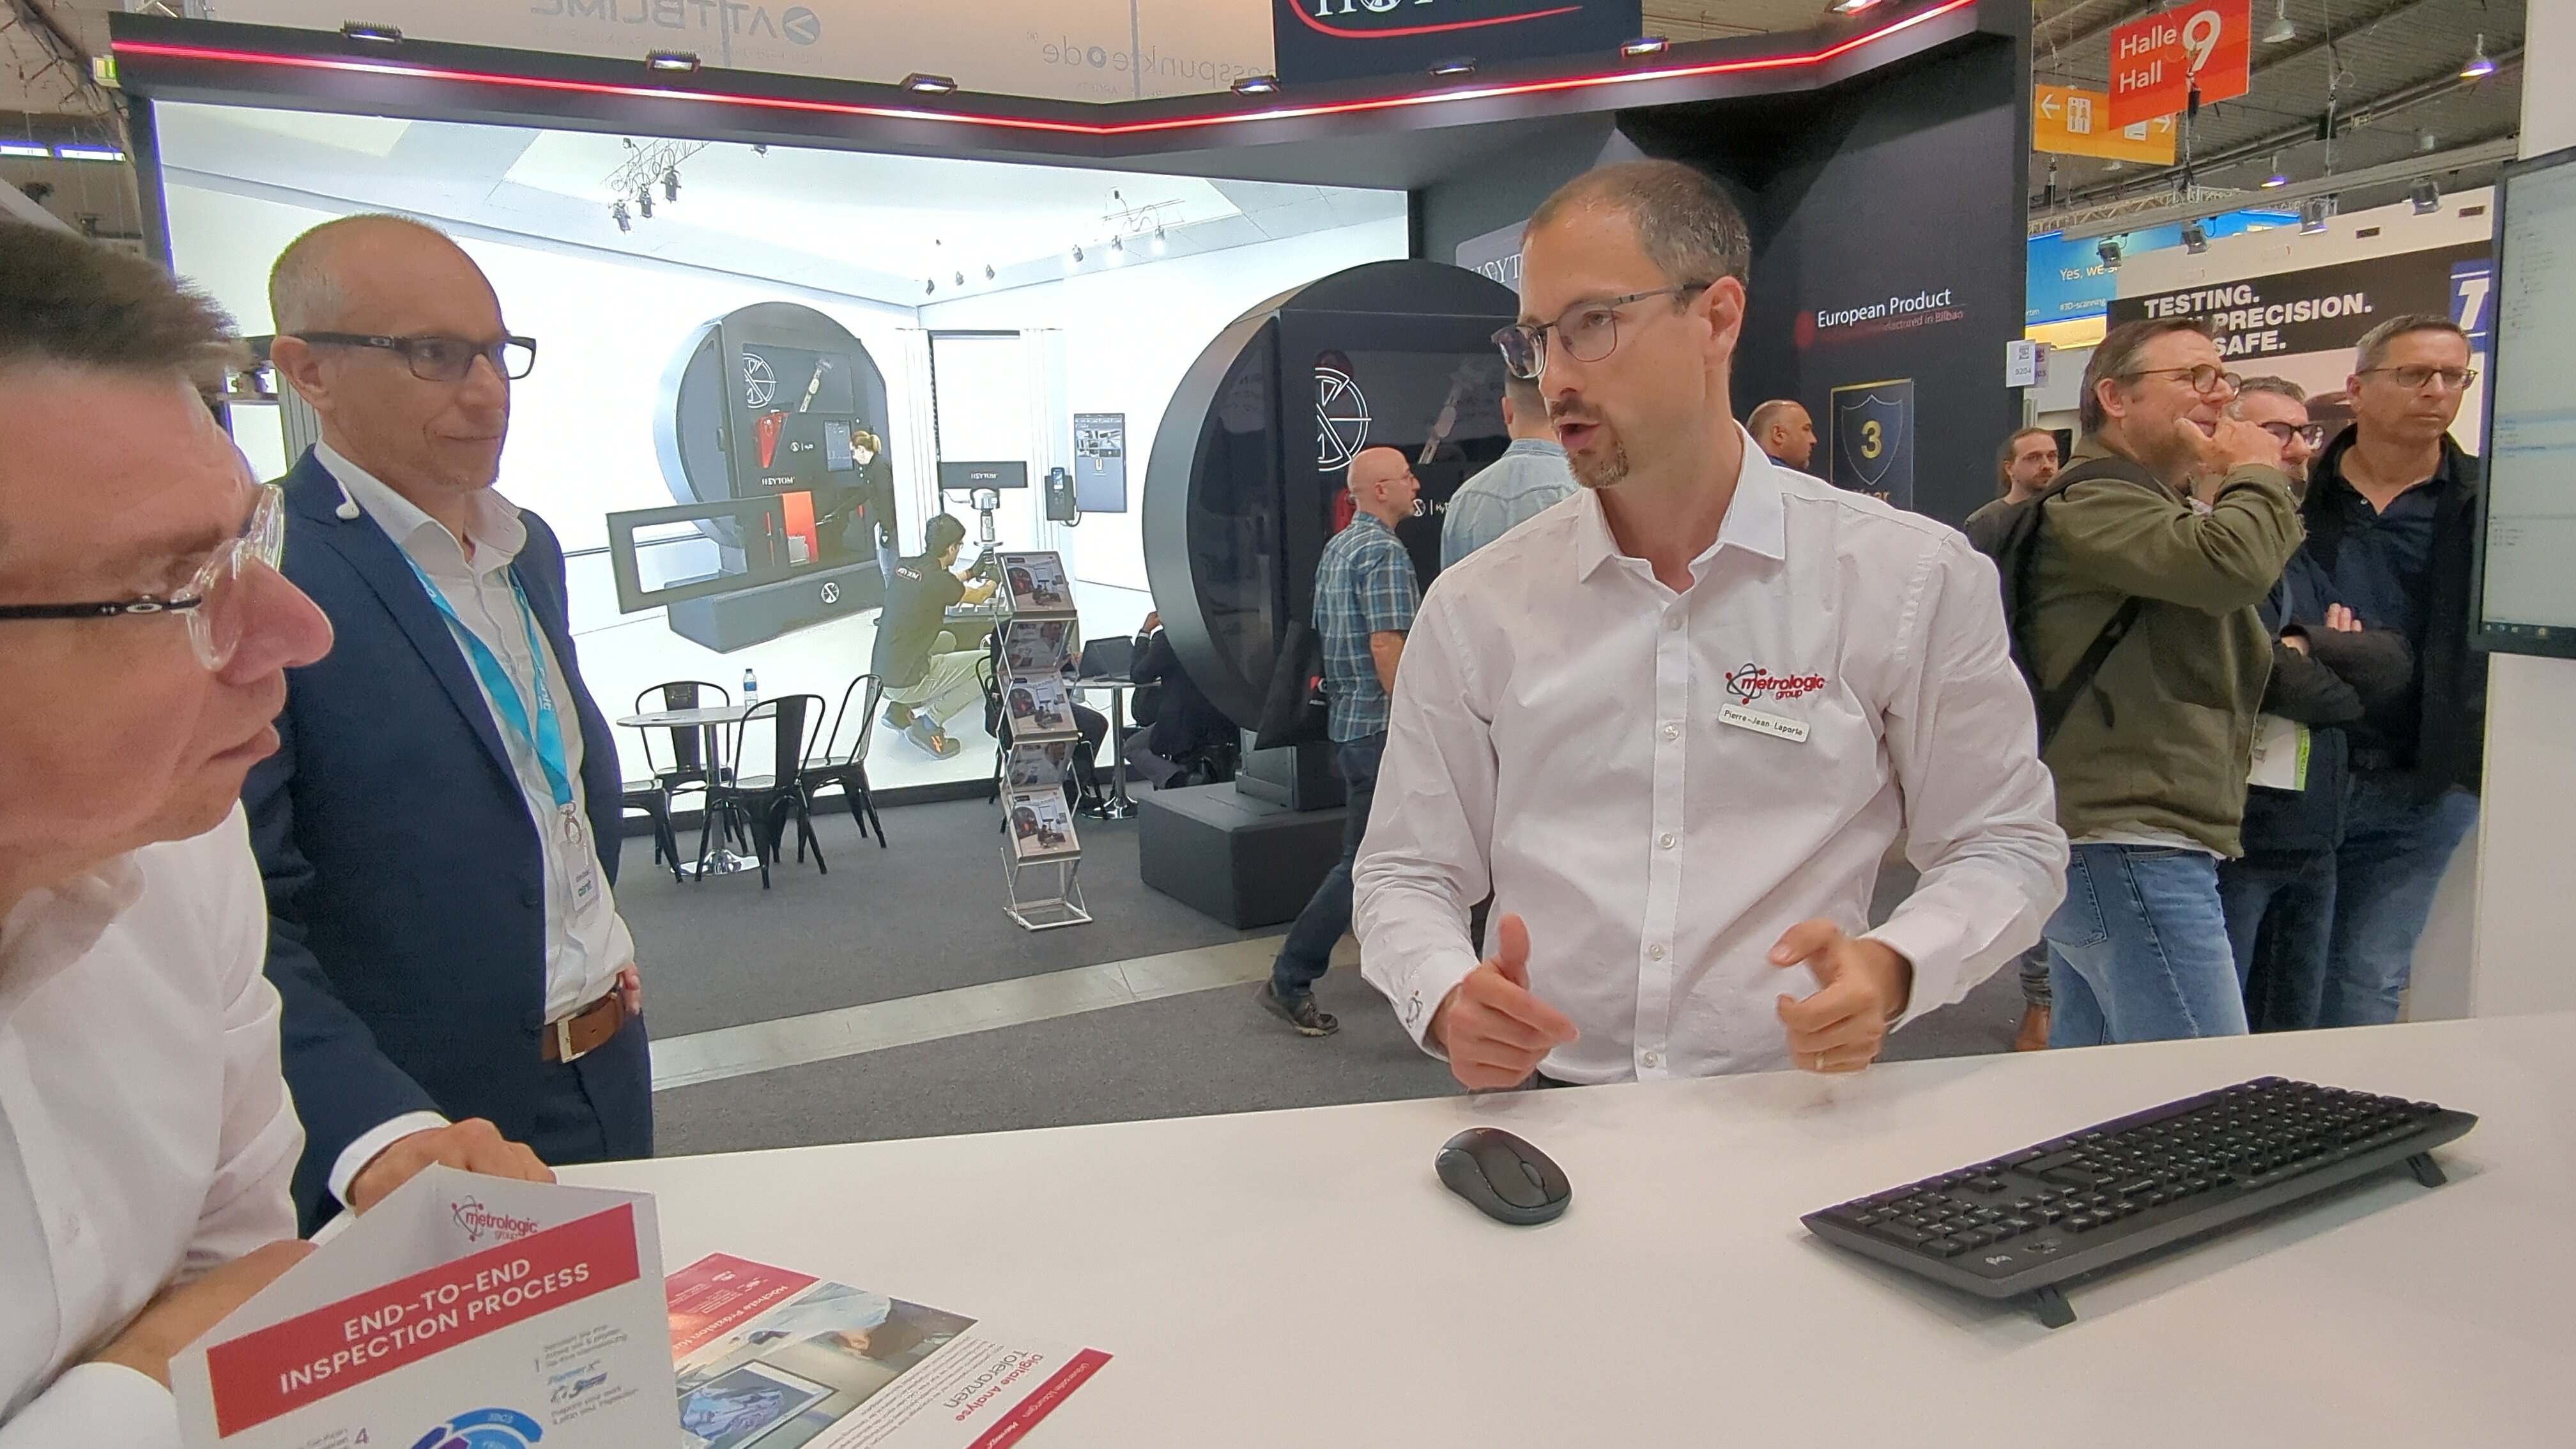
The event was recorded from booth 9102 - Hall 9 on the Control Messe show floor.

Join the Show Like You Were There
Watch the team from CENIT as they navigate the entire Model Based Enterprise approach -- starting in CAD and following the model through measurement and production monitoring.
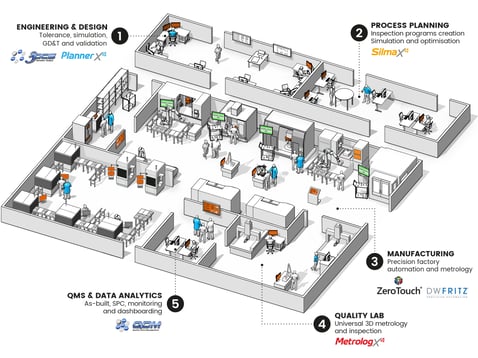
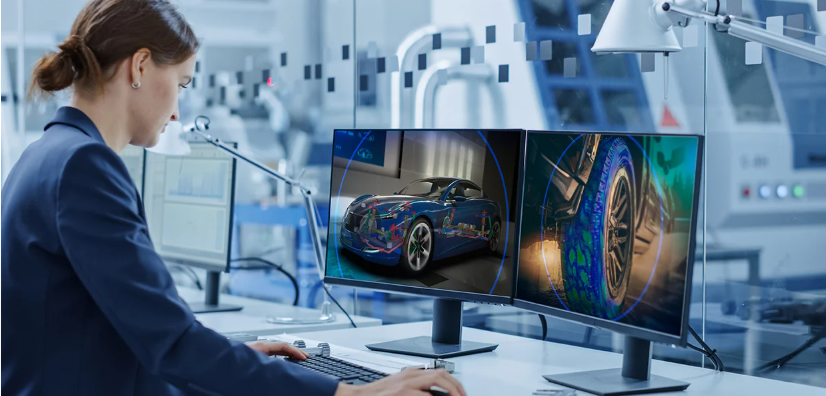
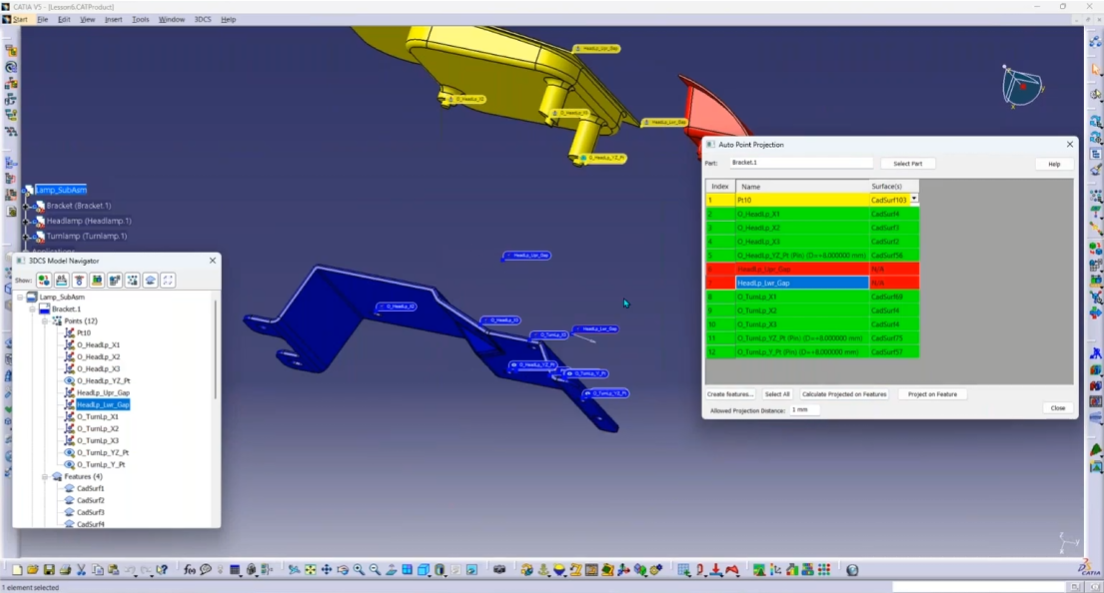
CAD Design and Optimization
It all begins with the 3D model (and ends). Using CATIA to design the parts, add FT&A (PMI / GD&T by another name), and then activate 3DCS Variation Analyst to test and optimize the GD&T for downstream use.
Simulating Measurements
While 3DCS simulates the build, measures, and provides insight into risk factors and optimization options, SILMA takes the PMI and creates measurement plans to validate the parts. What makes this so useful, is not only are these measurement programs correlated to the CAD model, but they can be created offline, keeping the machines running without interruption.
Understanding the Program
Machine-optimized programs created in SILMA are efficient and elegant in a way human-made programs rarely are. This is due to pathing and efficient use of space. Instead of creating a large no-go zone around the part, the software creates a layer around the part, letting the tool slide past the part to reposition itself. This drastically reduces the measurement cycles while keeping the measurement quality the same.
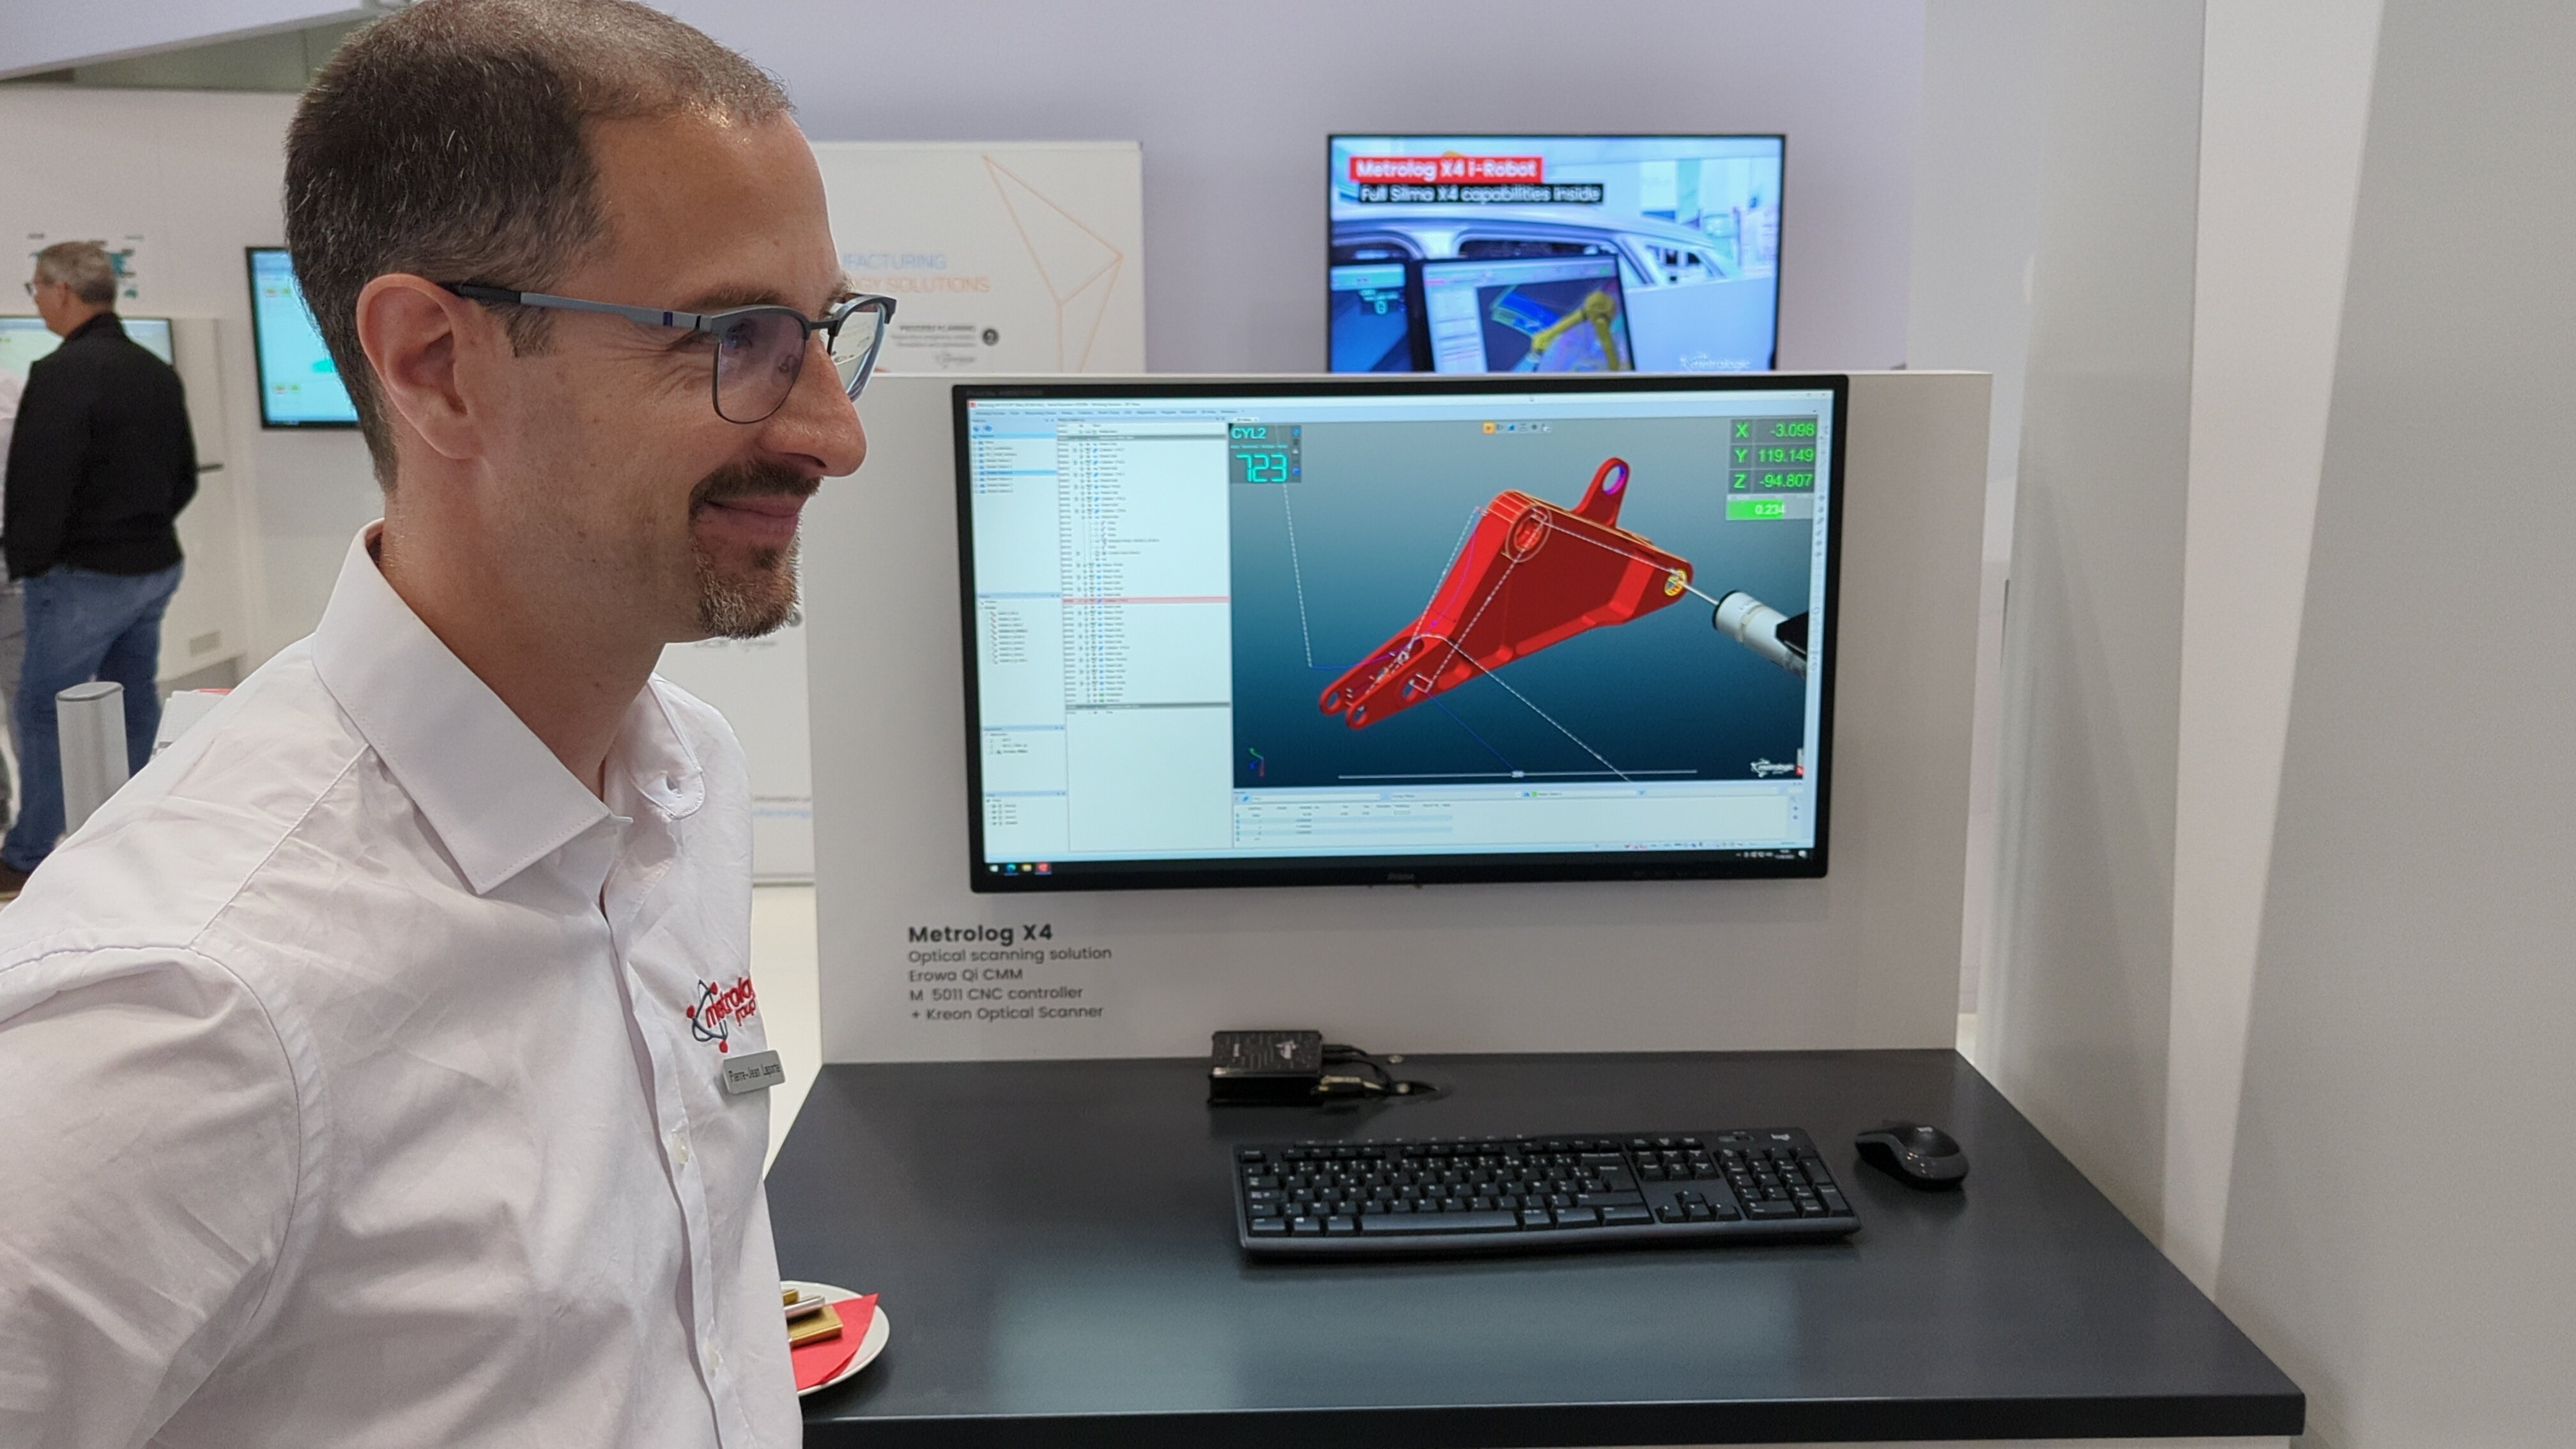
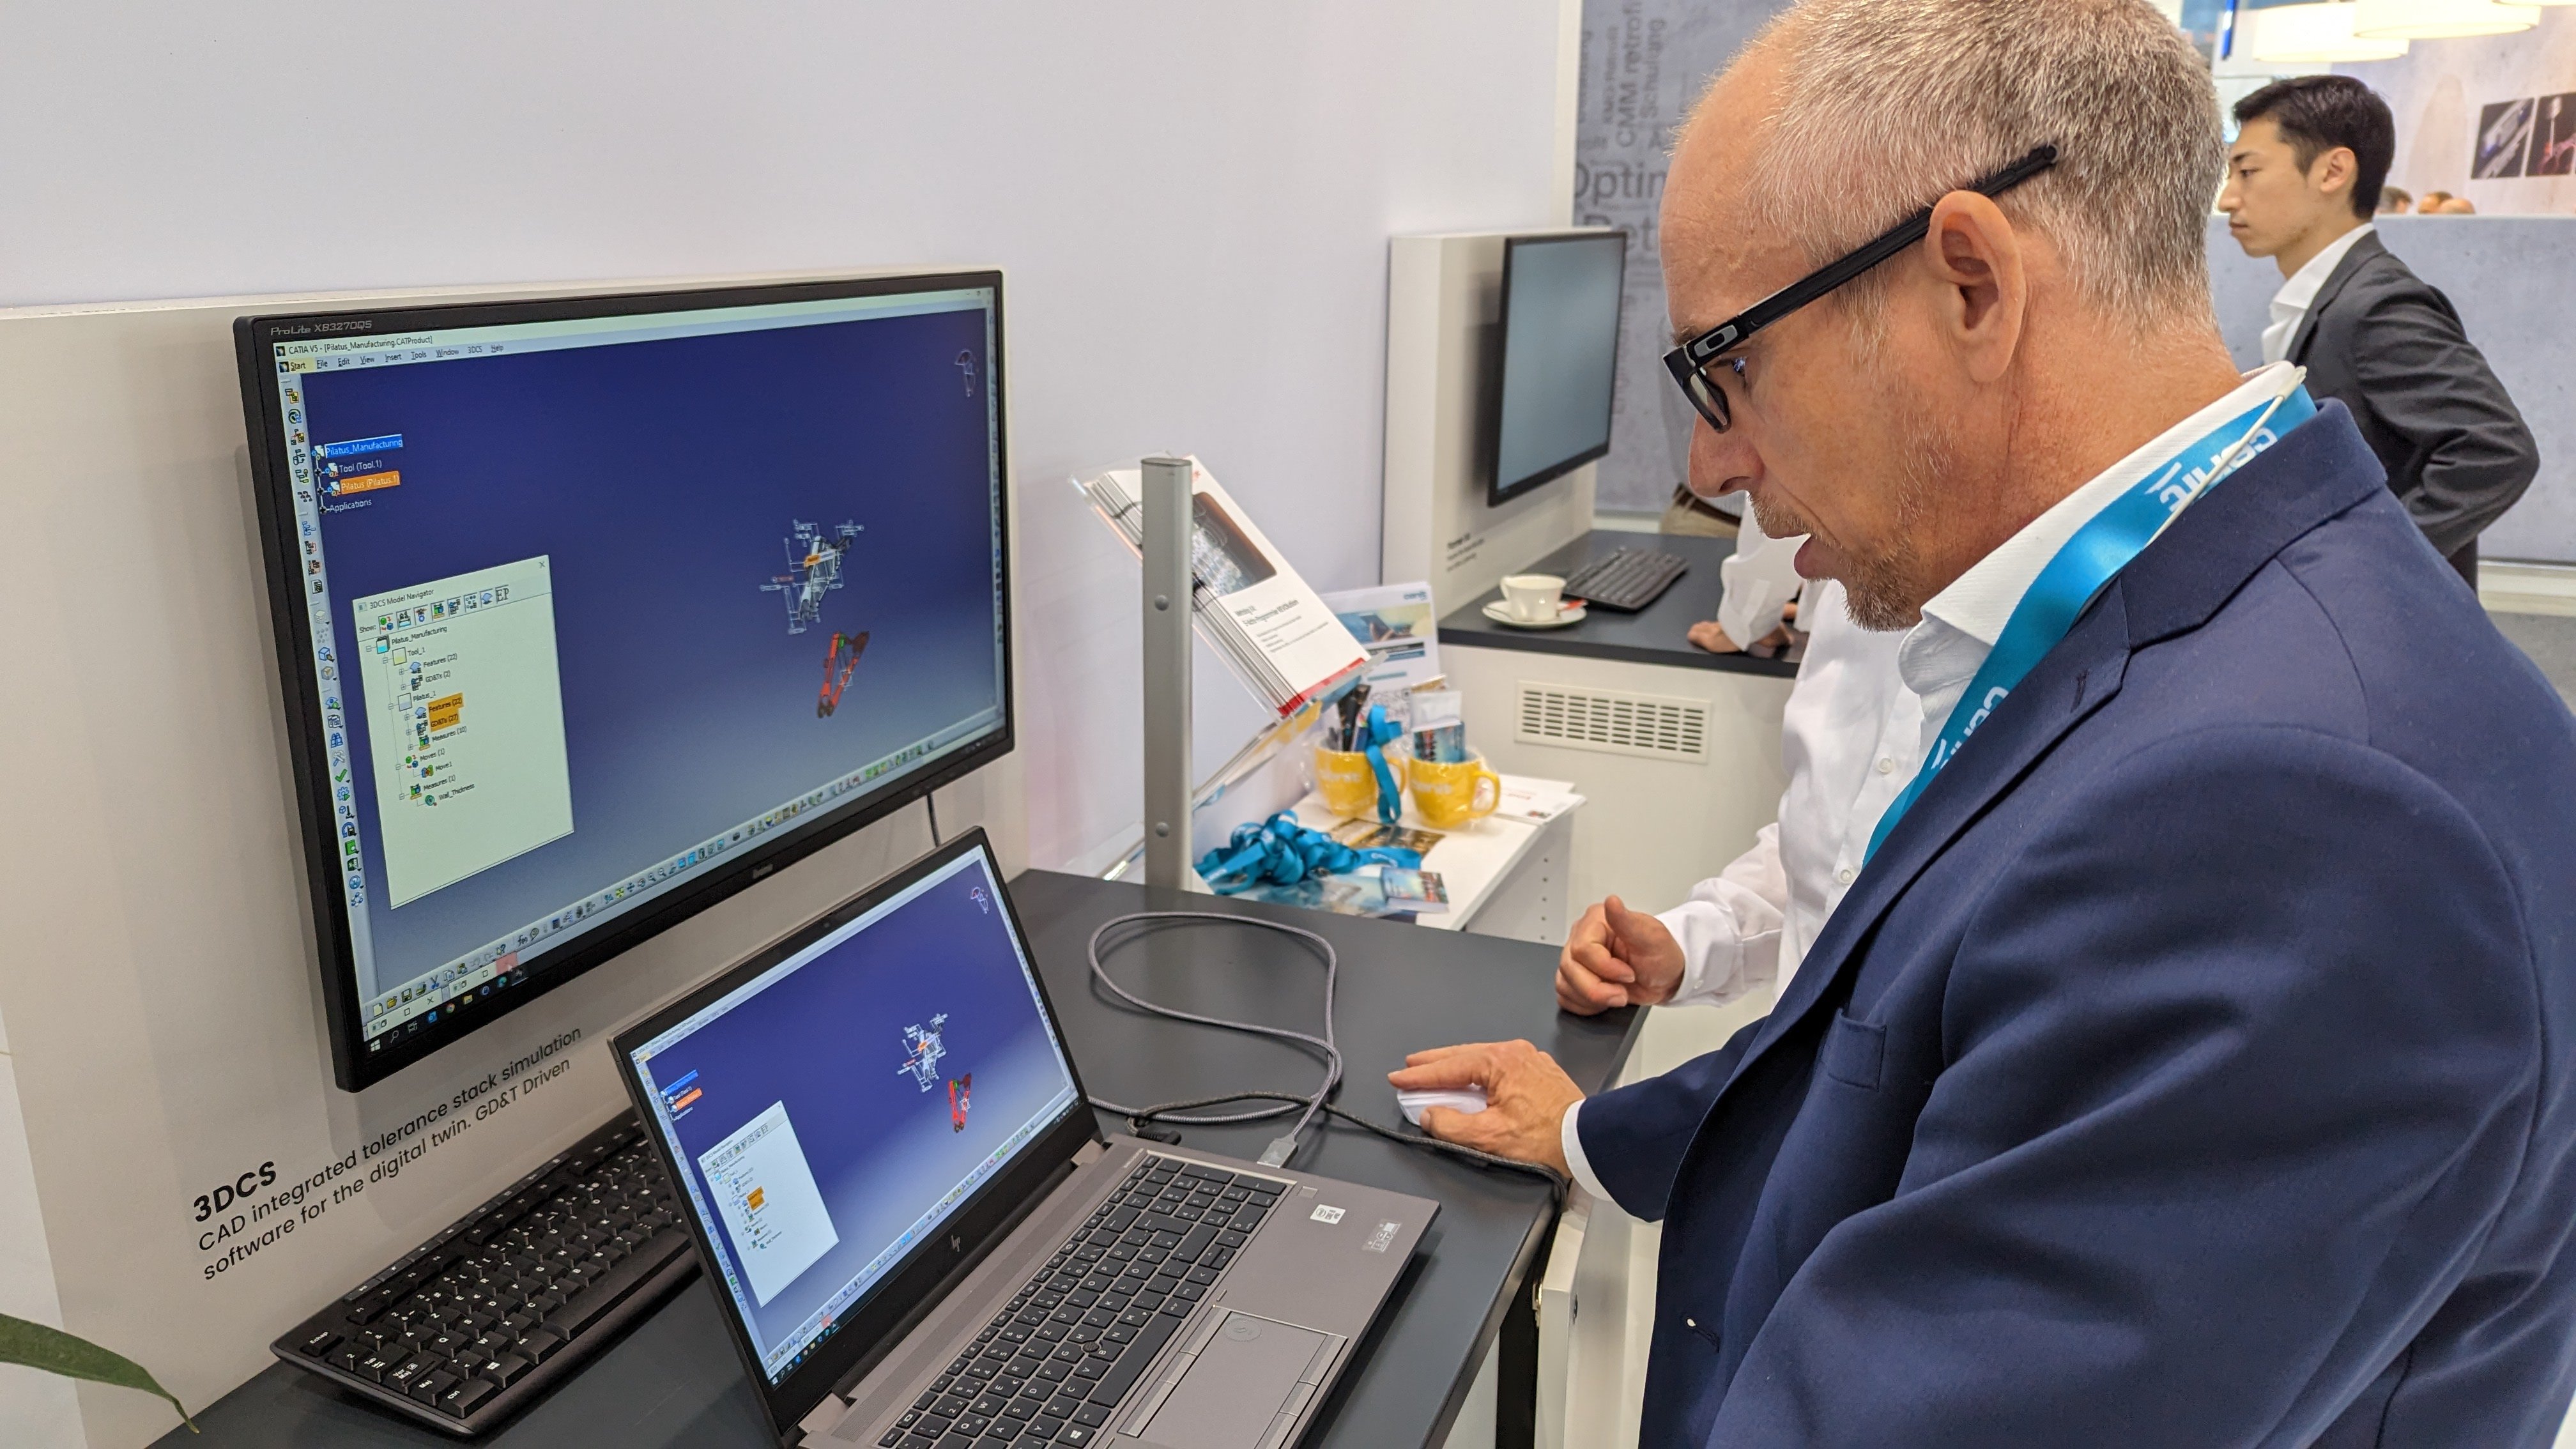
Measuring the Parts -- 5 Axis CMM
This part was measured with a 5-axis CMM, allowing the CMM to access areas that cannot be reached with a 3-axis, and to do so with much greater efficiency. The software, Metrolog X4, shows exactly what operation is being done, how many points, and the relevant measurements alongside the program steps. These steps can be changed, altered, rearranged, or adjusted depending on the operator's needs.
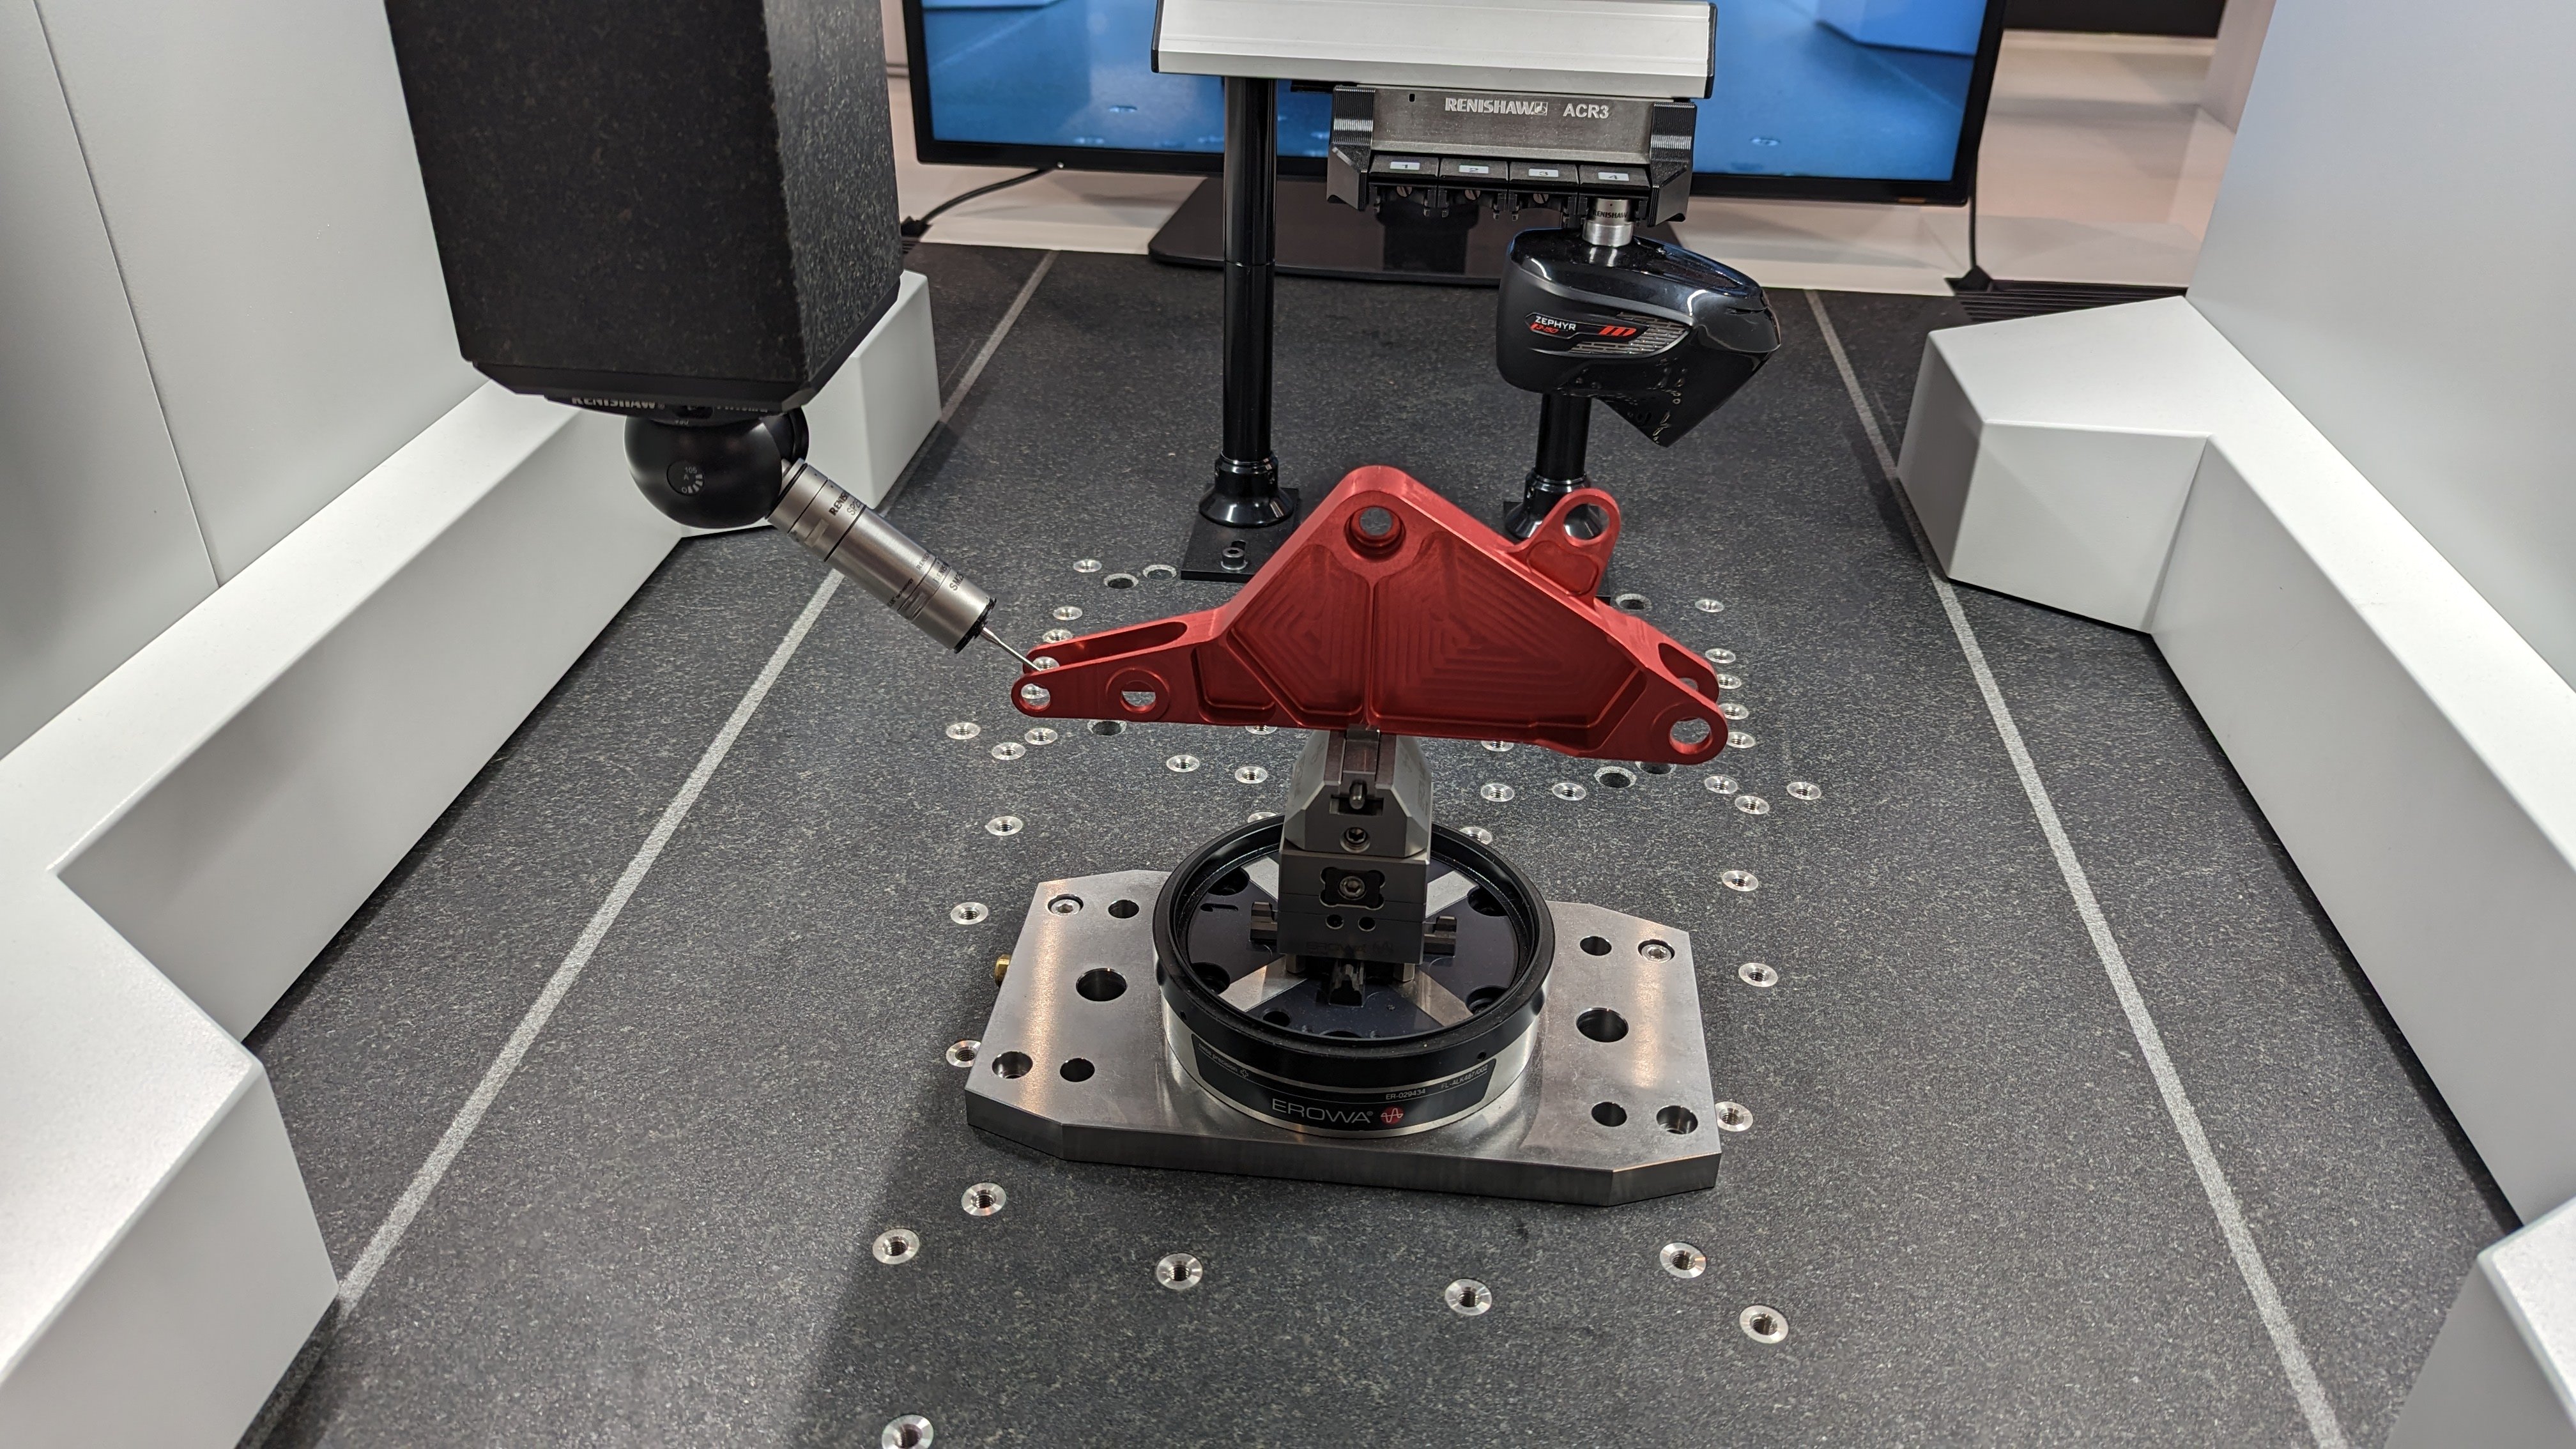
Getting Measurement Results
The CMM quickly measures the part, getting accurate results from multiple features tied to the CAD model's GD&T. These correlated points are important for later when the CAD model is used for root cause analysis and problem-solving of non-conformance and out-of-specification situations.
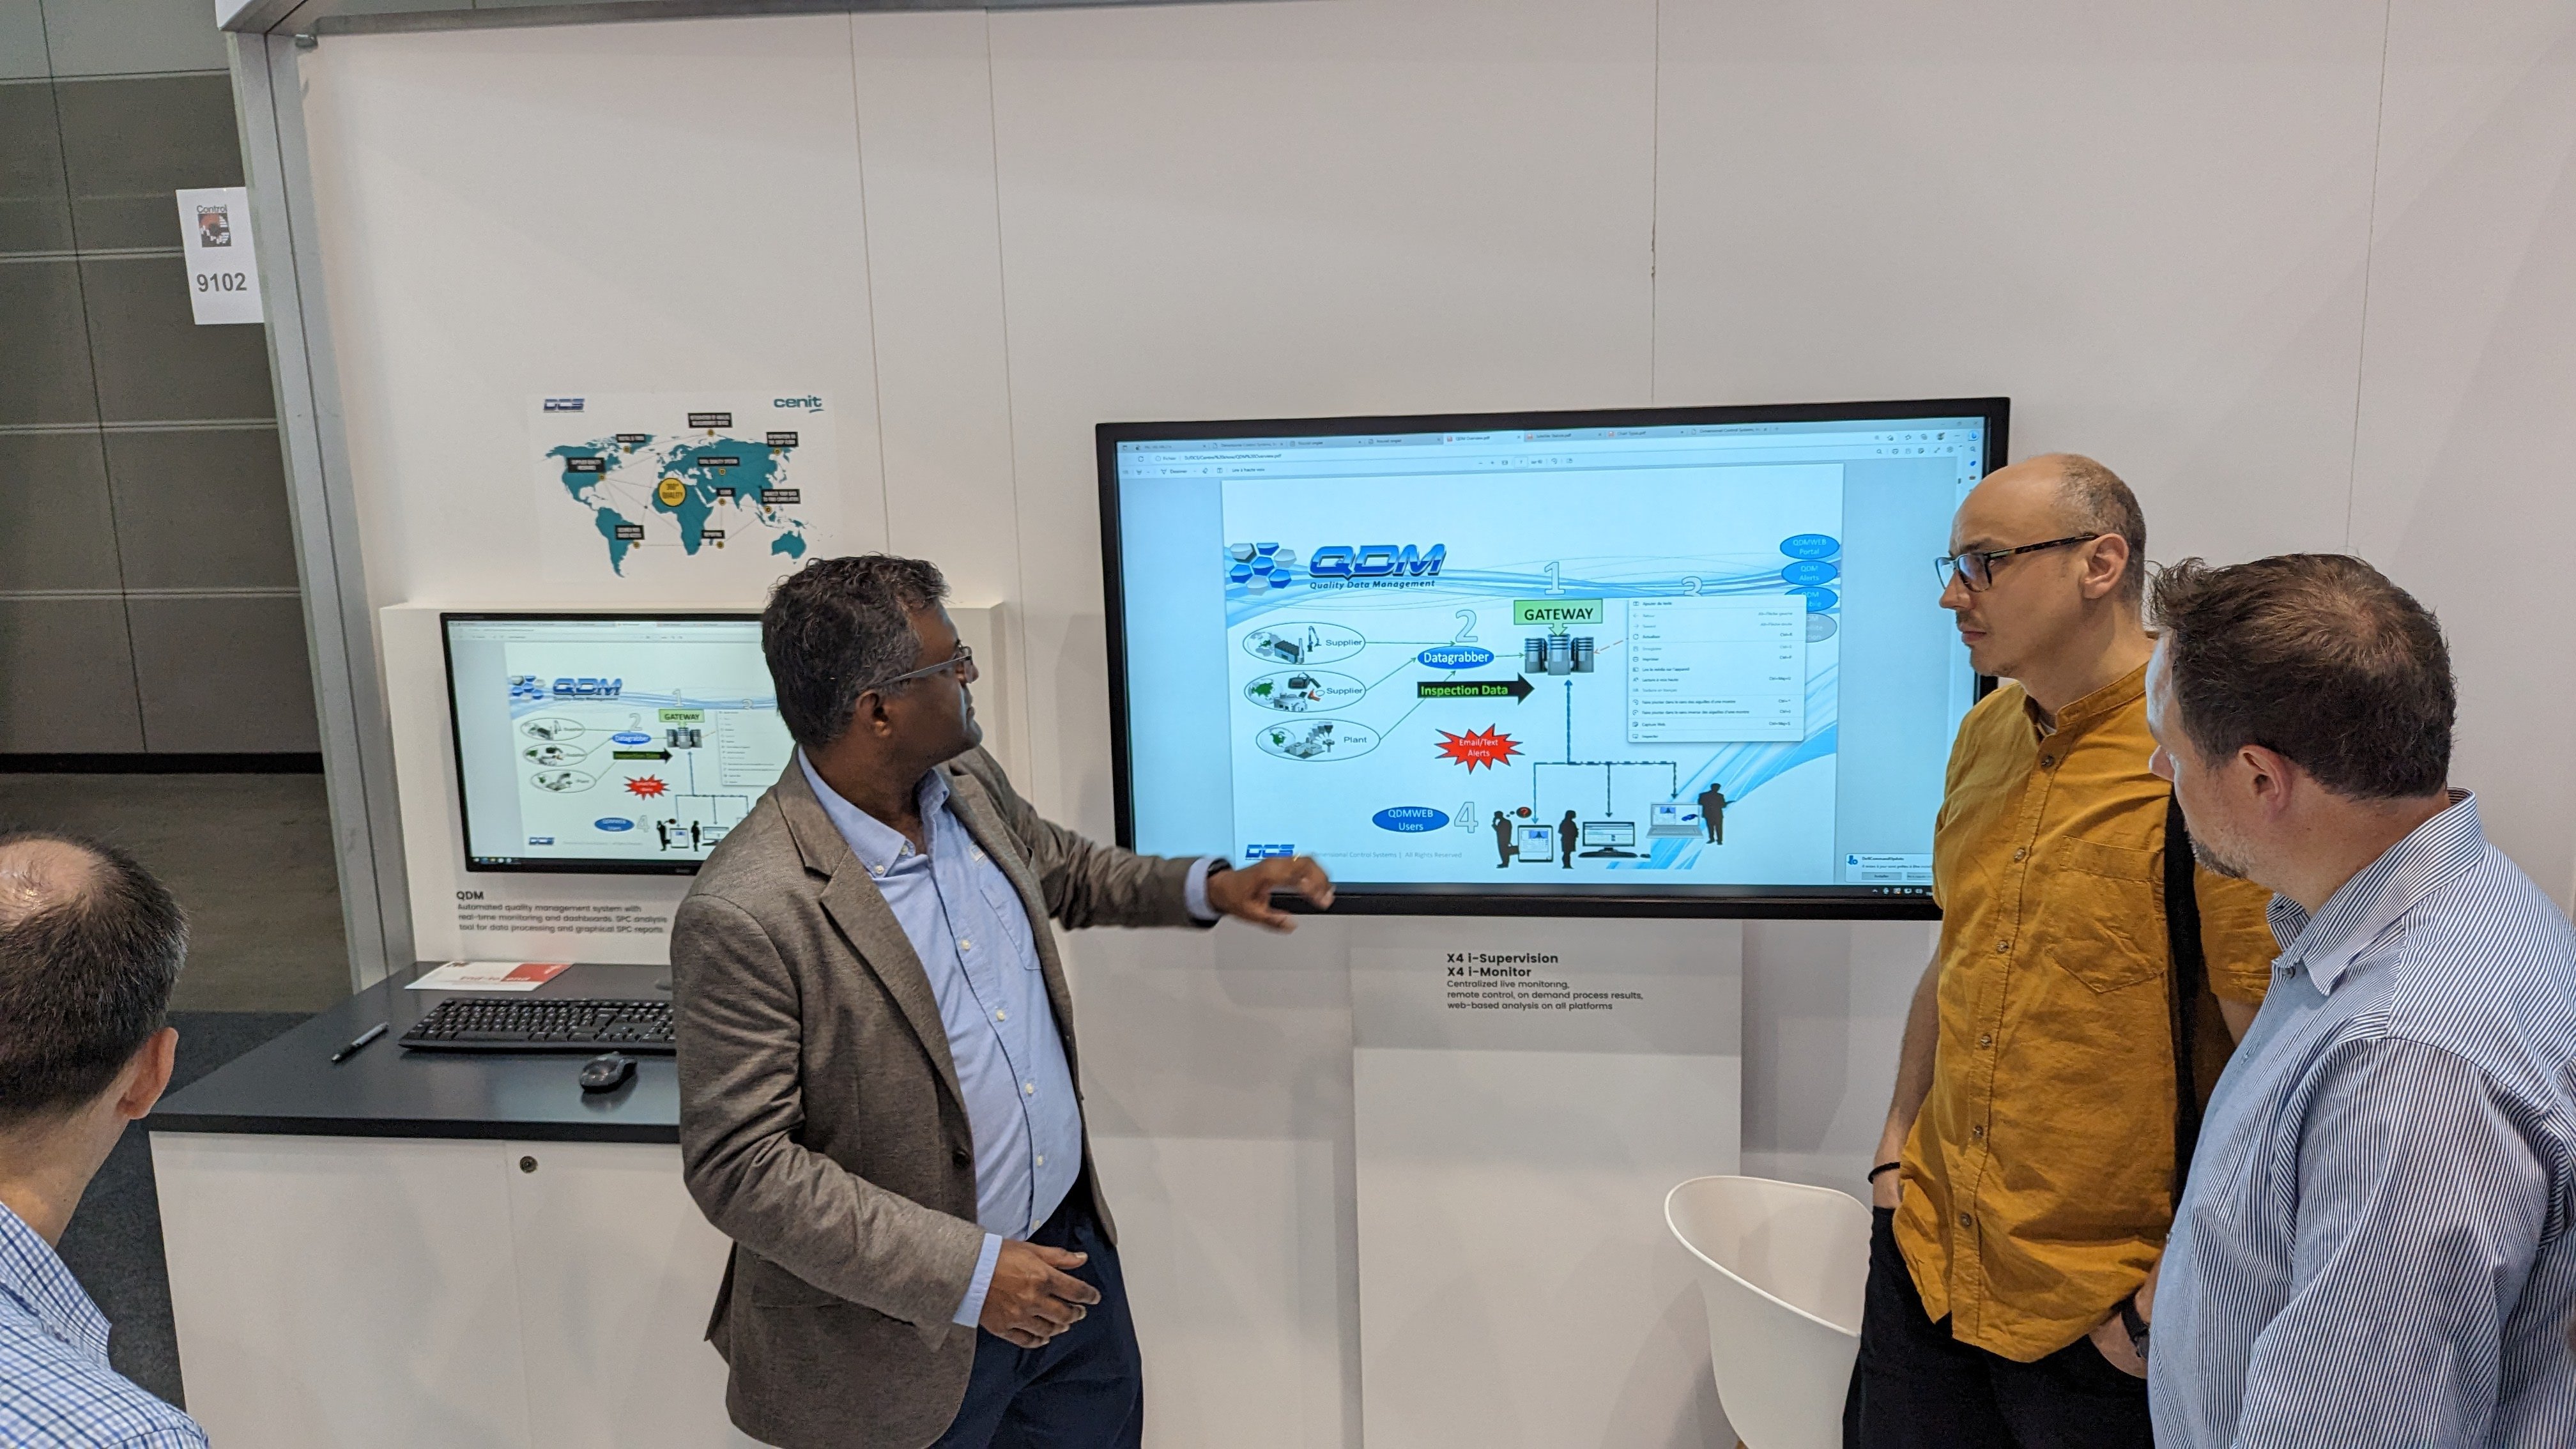
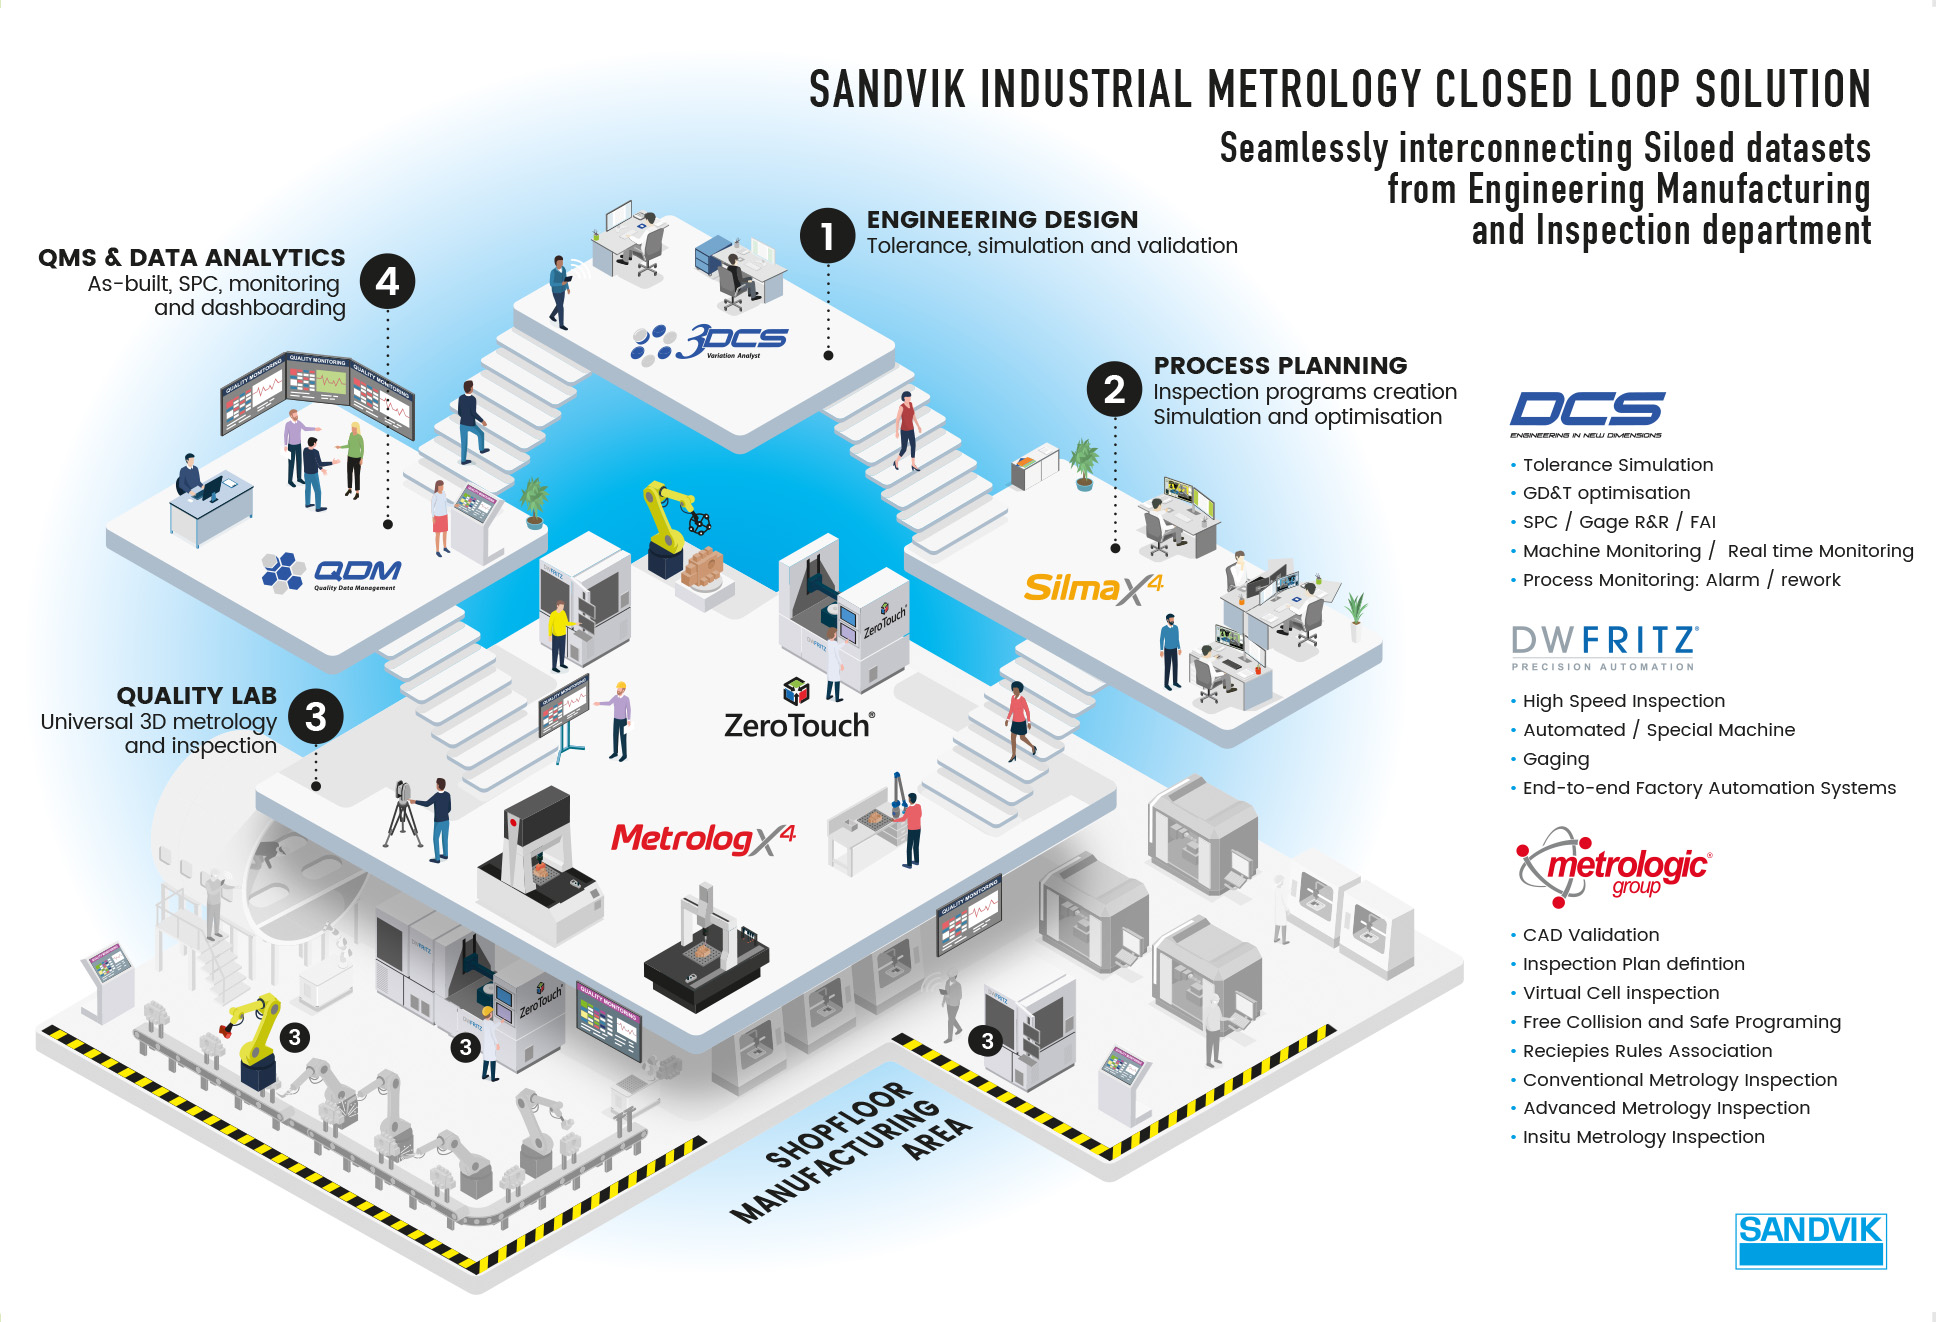
Collect, Monitor, Analysis the Measurements
QDM SPC Platform collects the measurements from all of the CMM's, measurement arms, scanning devices, and Excel sheets of hand measurements. Once together, these measurements are all standardized, stored, and then mined for dashboards, reports, and alerts. While this is going on, QDM now also monitors all of your machines for uptime, issues, and runtimes with an easy-to-understand plant floor overlay.
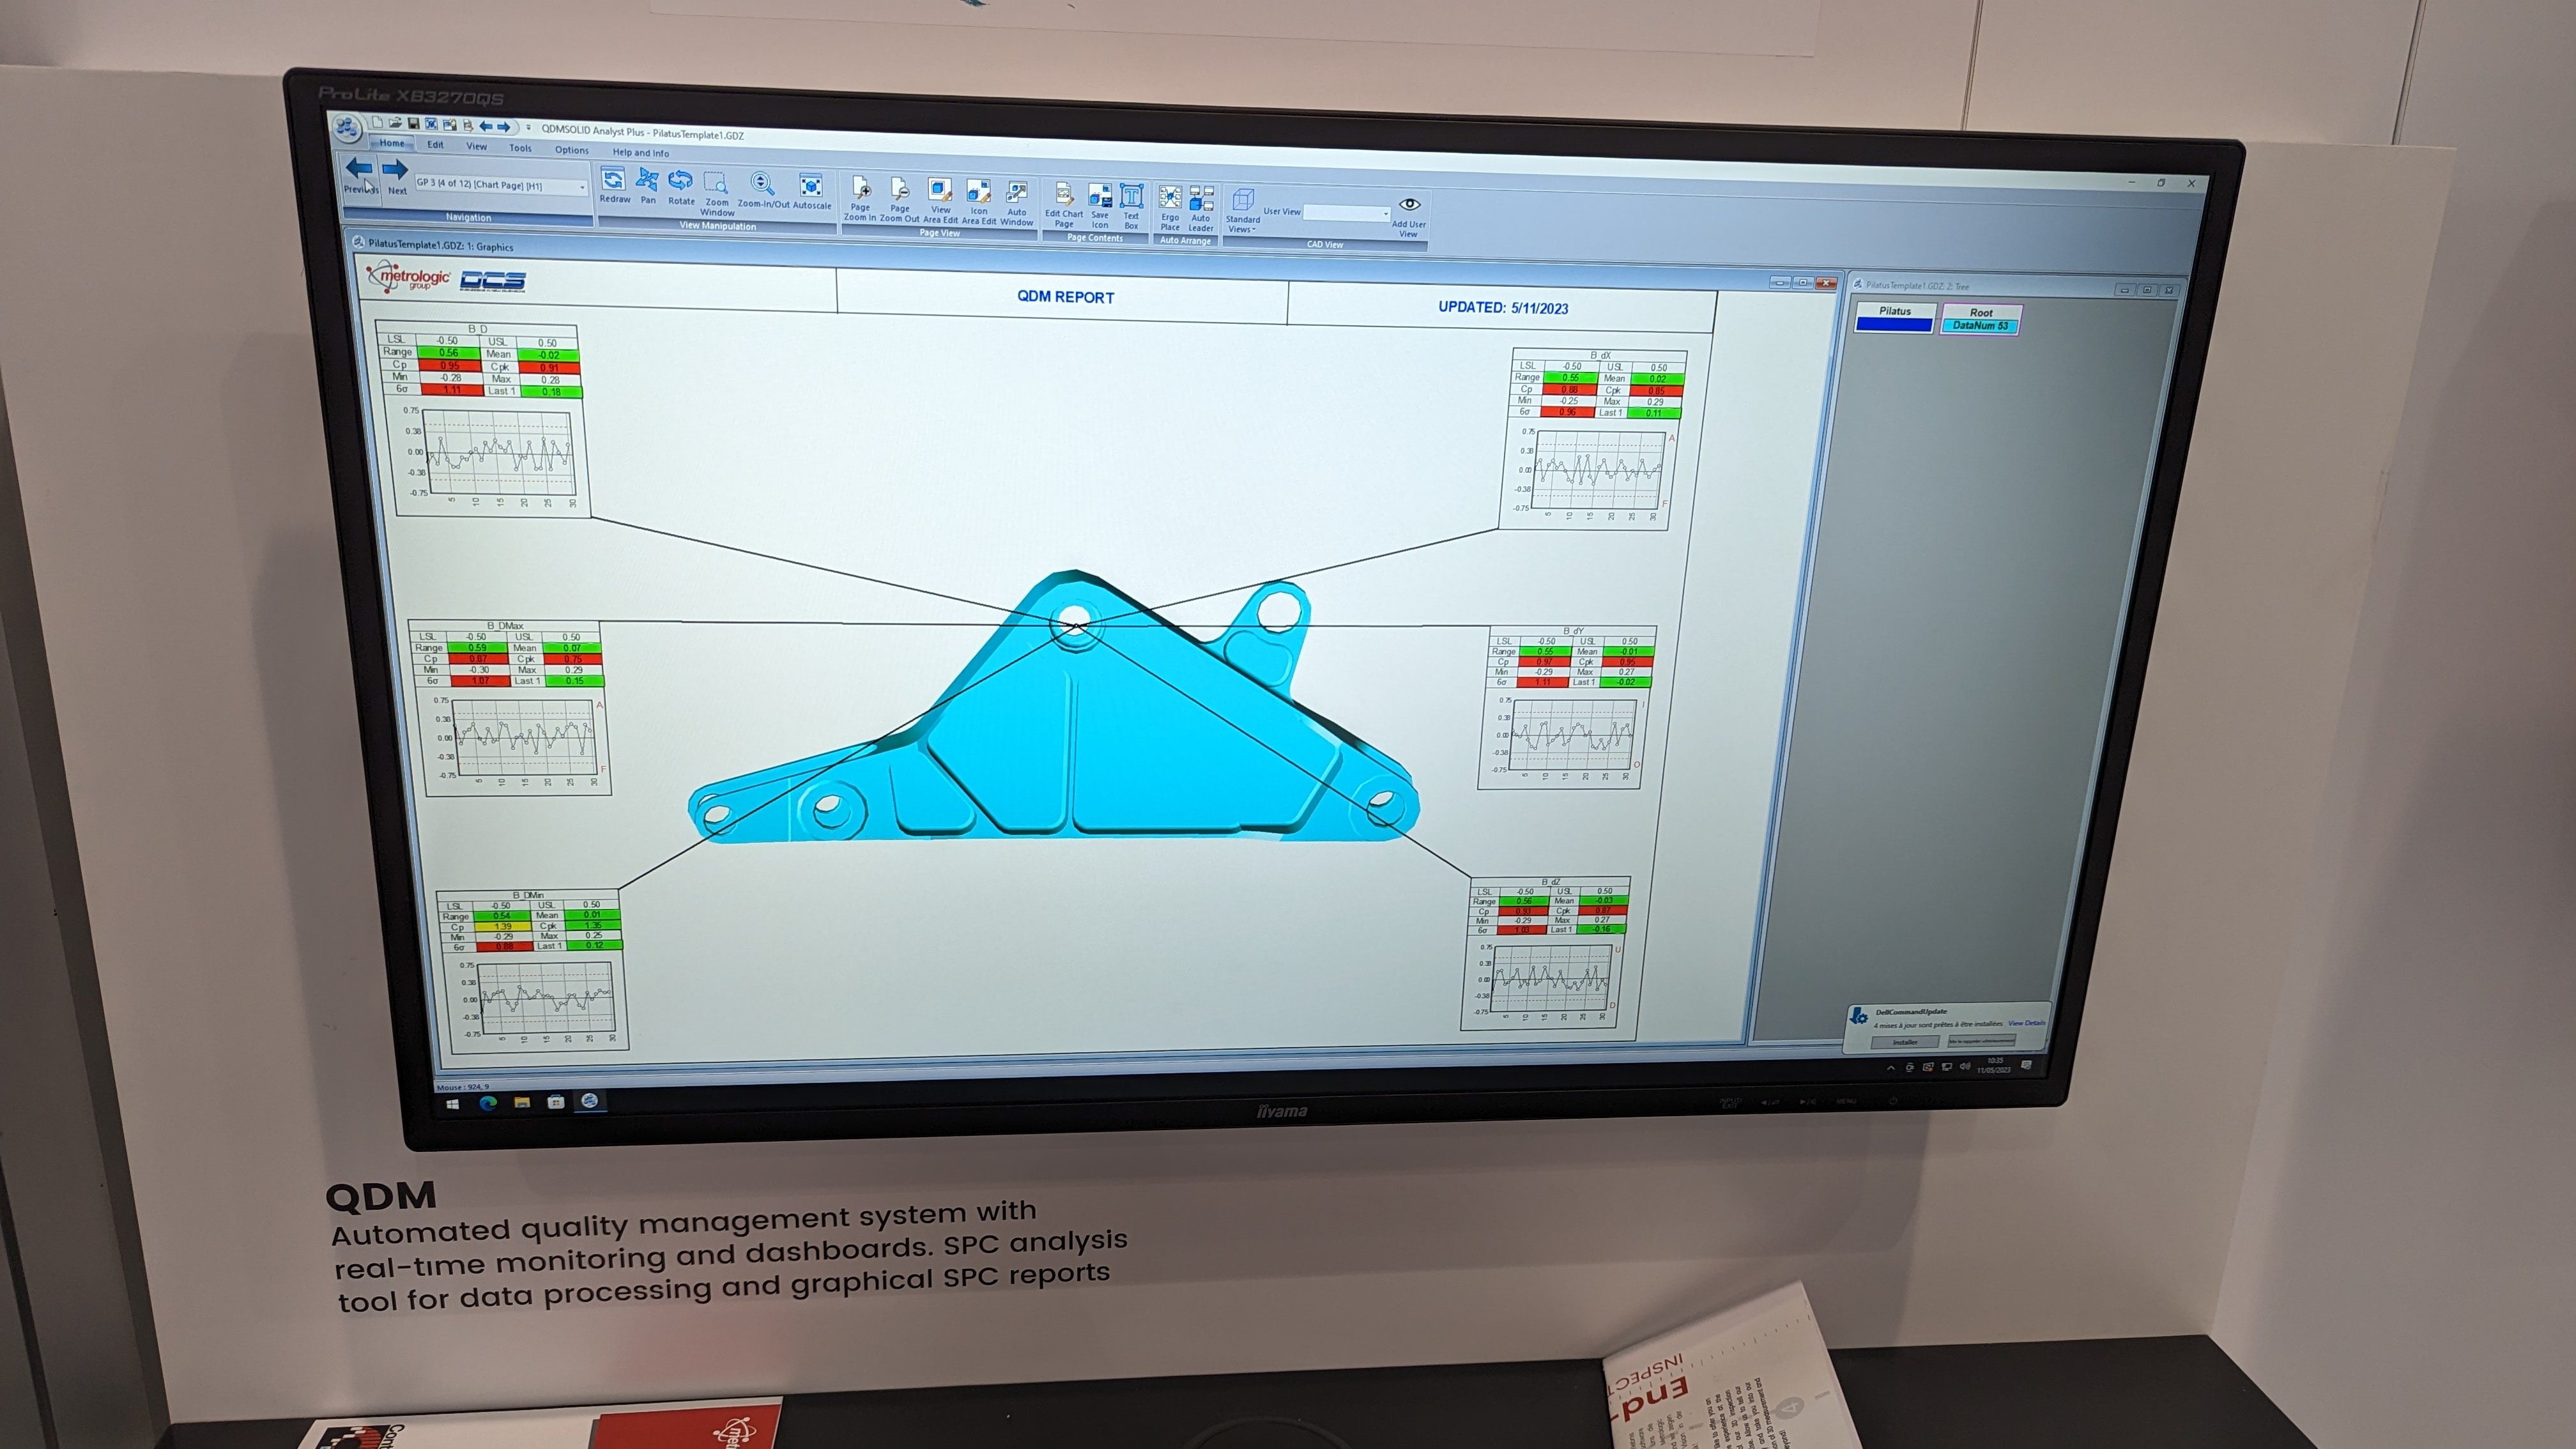
Seeing is Believing
See all of your measurement data and SPC charts laid out with quick look color coding to see exactly where problems are starting. The CAD model acts as an important piece of context, making it easy to see exactly where the problem is on the part. This can save valuable time when issues arise, while keeping the entire plant floor and quality team on the same level of understanding.
Closing the Loop - Return to CAD
Monitoring quality is important, but what do you do when something does go wrong (and it always does...)?
With the PMI GD&T acting as the central driver of the entire story, the measured data is already correlated to the CAD points, enabling an easy replacement of simulated data in the model with real data. From here, statistical analysis using 3DCS Variation Analyst provides the answers you need to find the problem, test solutions, and roll out a complete fix without wasteful trial and error.

It All Comes Together
This process flow is just the start. With an open ecosystem, you can incorporate all of your existing software and hardware into the process flow, allowing you to streamline and automate data connections to improve overall production quality.
Come join us to see it for yourself!
Walk through the process with us at the Control Show and see firsthand how Shopfloor Quality 360 can make your life easier. Click below to register for the event FREE>

|


No Comments Yet
Let us know what you think