So how does this solution work?
This week's blog post shows the steps with examples for applying Actual Measurements in QDM and 3DCS, and how these two solutions interact.
(This example requires 3DCS Variation Analyst and QDM Analyst)
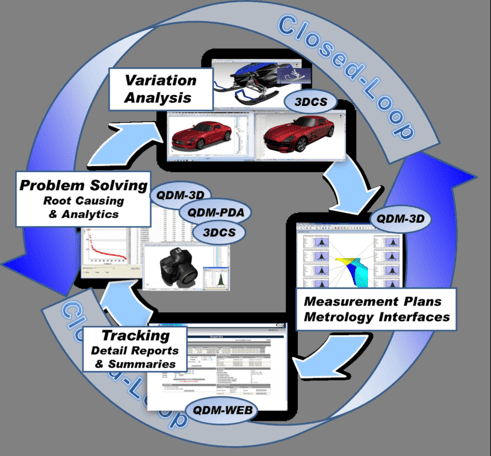
Example of a Closed Loop approach using DCS Solutions.
The purpose of implementing Closed Loop processes is to provide a coordinated quality strategy for dimensional simulation, physical measurements, statistical analysis, reporting, problem solving and correlation of manufactured product results to simulation results, based on actual measurements of the product.
Actual Measurements are the result of a variable measuring process executed with some type of instrument, machine or device for the purpose of determining the amount of deviation from the engineering defined product specification. Some examples include CMM's (Coordinate Measuring Machines), laser scanners, visual scanners, handheld laser gages and hand gages.
To get started, let's get some techical terms out of the way:
The example Closed Loop begins with Variation Analysis, using 3DCS. In this case, as the variation analysis is not the primary focus of the example, you can see how this is done by viewing DCS's video here.
Once complete, you will need to create a Measurement Plan.
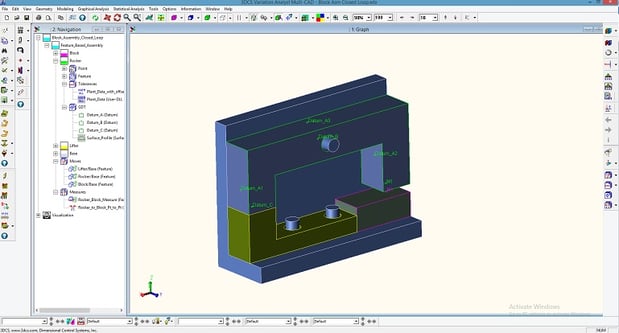
To begin, have your model open in 3DCS (CATIA V5 or Multi-CAD).
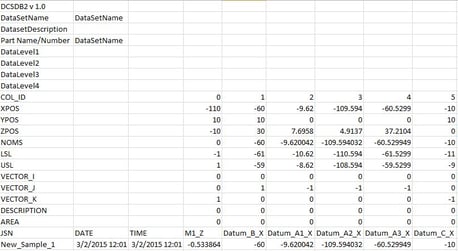
Next, export a Data Set as a DCSDB2 file. The DCSDB2 file is used to export the available points in the model to communicate the locations to QDM. The file will have each point and one sample. Here is how to export a DCSDB2 File:
Here is an example of what your file might look like:
Next, we use QDM Analyst, the module for report authoring in the QDM System (this is available as a stand alone product or as part of a system setup).
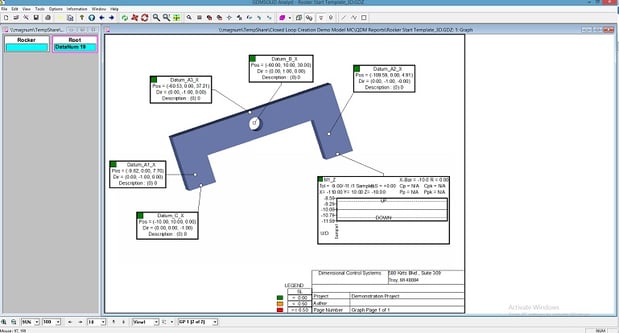
1. Create a new template
2. Import the CAD files, go to File -> Open: Select the Rocker.hsf (this uses the 3DCS CAD. QDM works with all major CAD files from CATIA, Solidworks, NX, etc...)
3. Import the Measurement Plan (DCSDB2) exported earlier from 3DCS. Go to File -> Import and select Data.
Note: Make sure when importing the data it’s specified as DCSDB2 (.csv)
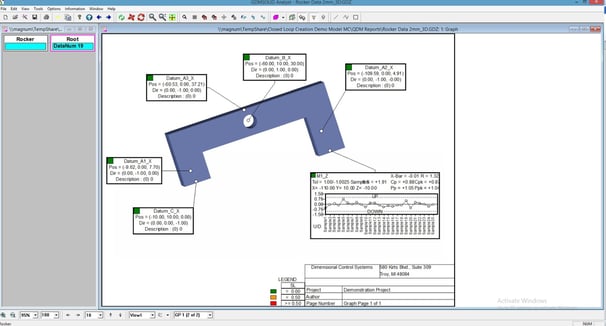
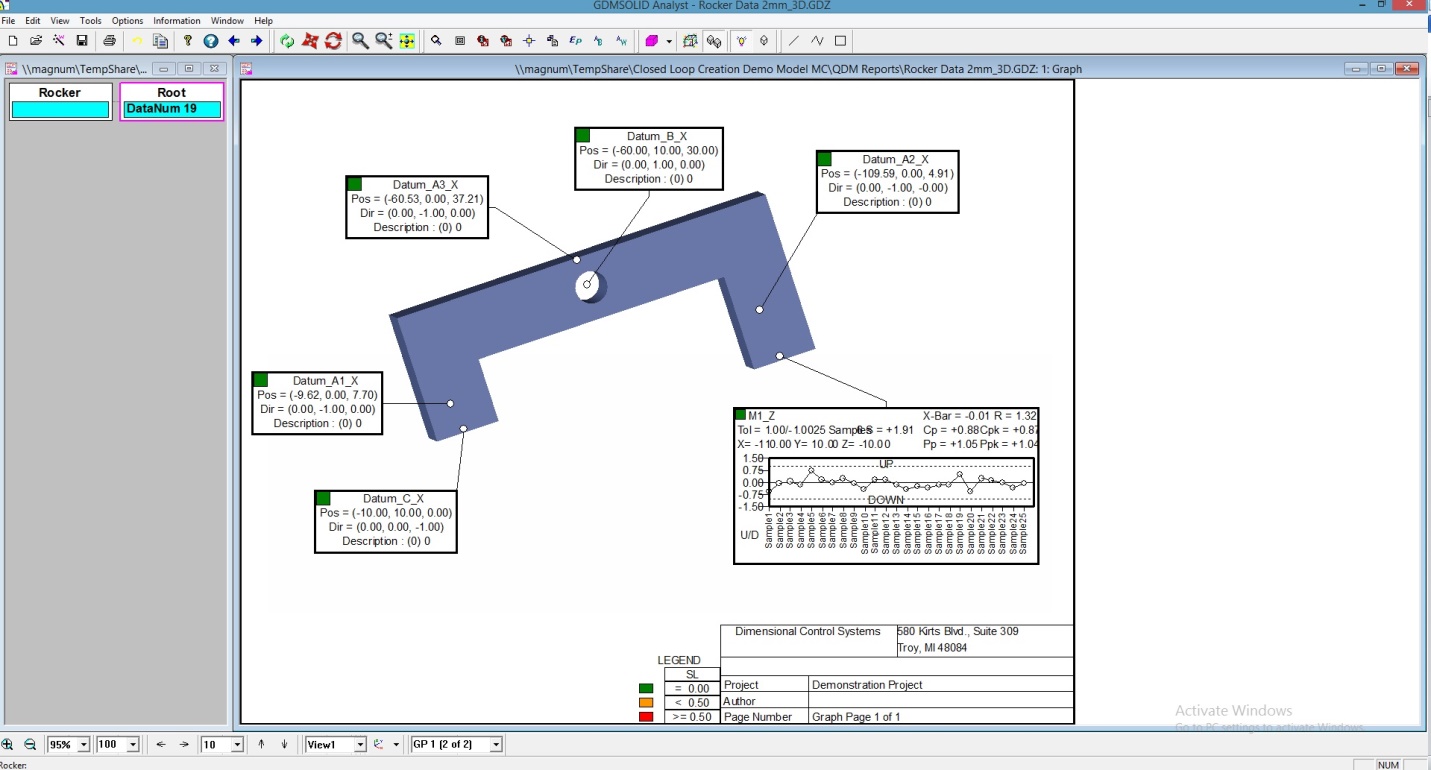
Above: The template with the points imported and a sample.
So let's recap on what we have done.
Using GD&T and tolerancing strategies, we've created a model in 3DCS (for this example. A model in NX or CATIA with PMI will work as well).
We've exported the measurement points (setup in 3DCS) and tolerance points as a spreadsheet, but without data. These are often referred to as KCC's (Key Control Characteristics).
That spreadsheet has been imported into QDM Analyst, along with the CAD model, showing the points we want to measure and track on the CAD model for reference.
CAD Model with tolerances/measurements --> export KCC's --> Import KCC's into QDM Analyst --> Import CAD into QDM Analyst
Now we need the measurement data from the plant. This can be gathered in a number of different ways, from a manually updated excel spreadsheet on the shop floor using a gap gun to a CMM machine. The coordinates can be exported from QDM Analyst for easy use in a CMM machine or can be communicated using a report (as a pdf or document).
Once the inspection data has been collected, it needs to be brought into QDM Analyst.
QDM Analyst can import raw data from any inspection device or from an excel spreadsheet.
In this case, a CMM machine was used, giving a text output. That output was imported into QDM Analyst, which analyzes and applies the data to the points in the template. This aligns the measurement points imported from 3DCS with the measurement data from the CMM machine. Once this is done, a new DCSDB2 file can be exported from QDM Analyst, which has the measurement points like before, but now also contains the plant data.
For simplicity, the process is as follows:
1. Export CMM coordinates from QDM Analyst
2. Use the CMM to measure parts from the plant.
3. Import the raw text output from the CMM into QDM Analyst.
4. Export a new DCSDB2 file (.csv). This file contains the points and plant data together.
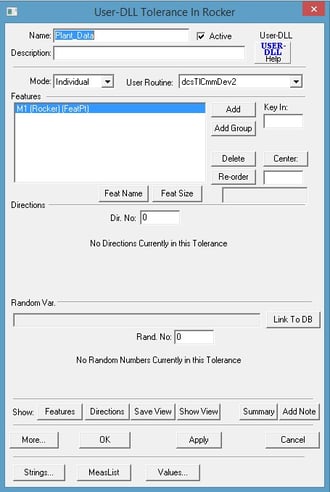
Now that the Plant Data is available, we need to bring it into 3DCS. To do so, we used a custom module called a User DLL. (This feature is slated to be integrated in an upcoming release).
Begin by adding the User DLL from the Tolerance Menu.
In order to implement the Plant Data in the 3DCS model, all other tolerances and GD&T need to be deactivated. The reason for this is that importing the new data adds that information to the same points that your simulation used, mixing the data together. By deactivating the previous tolerance data, you can isolate the plant data in your model, letting you analyze and work with just the measured information.
To deactivate the simulation data, Right-click on both Tolerance and GD&T nodes and select On/Off to deactivate all available tolerances.
Note: If any datums are available in the model, they will not deactivate when using the On/Off function. (They do not need to be activated)
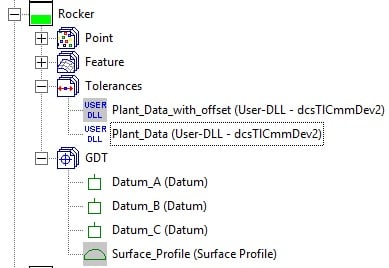
Above: Deactivating the simulation data.
Now let's do a basic analysis of the plant data vs the simulation data.
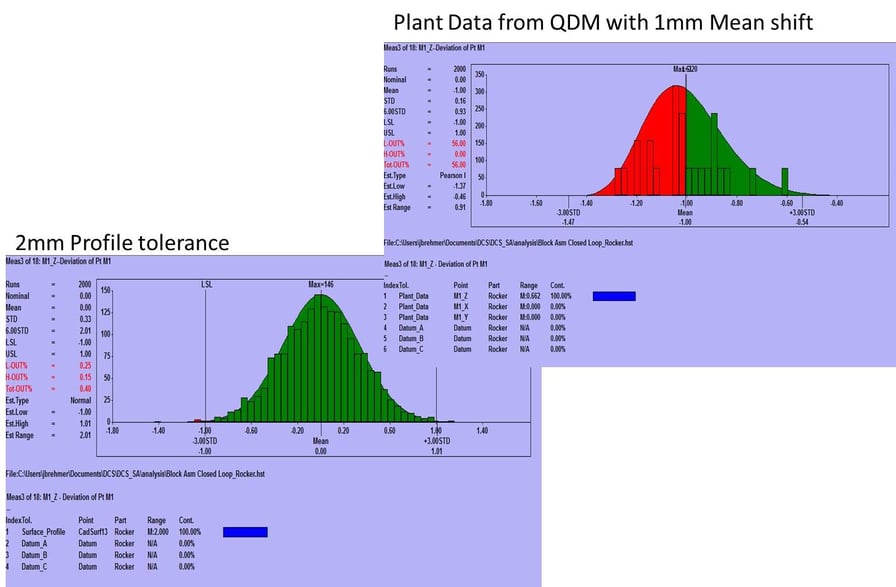
Click Nominal Build and run a Simulation. You can see in the lower right image the Plant Data with High-Low-Mean (HLM) values, as well as the Key Contributors to Variation.
The simulation data is on the left for comparision.
Download the article for easy sharing
For best results, use 3DCS version 7.3.1.1 or later and QDM Analyst version 7.0.4.31 or later.
To find more information about Closed Loop check out the DCS Community at http://community.3dcs.com, or learn more at http://www.3dcs.com/more-info.html.
Sign up for DCS's newsletter (http://www.3dcs.com/mailing-list.html) to get each month's Tips and Tactics and DE Focus right to your mailbox.
Questions? Call or email DCS, and we’d be happy to help.
DCS Dimensional Control Systems
580 Kirts Blvd ste 309
Troy, MI, 48084
(248) 269-9777
These Stories on 3DCS
No Comments Yet
Let us know what you think