
Tolerance Analysis can be a simple function. Using RSS and Excel, tolerances can be calculated as a stack-up to determine the range of variation. However, as soon as this method is used for real parts in an assembly, this method begins to lose its validity. Incorporating the variation from 3 dimensional effects can make the math extremely difficult and hard to reproduce quickly, leaving out variation that can cause expensive problems during manufacturing.

To understand the variation left out in Excel stack-ups, let's talk about common stack-ups.
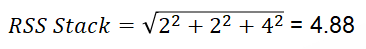
Statistical Analysis - Each component’s variation is modeled as a statistical distribution (typically Normal) and these distributions combine to predict a new distribution that describes the assembly variation, not the extreme values (outliers) of that variation.
Statistical Analysis (RSS) carries some risk that bad assemblies will be made from good parts, but using inspection to spot trends and adjusting accordingly is a far cheaper solution than manufacturing to incredibly tight part level tolerances (as a Worst Case analysis would recommend).
https://www.3dcs.com/understanding-worst-case-tolerance-analysis
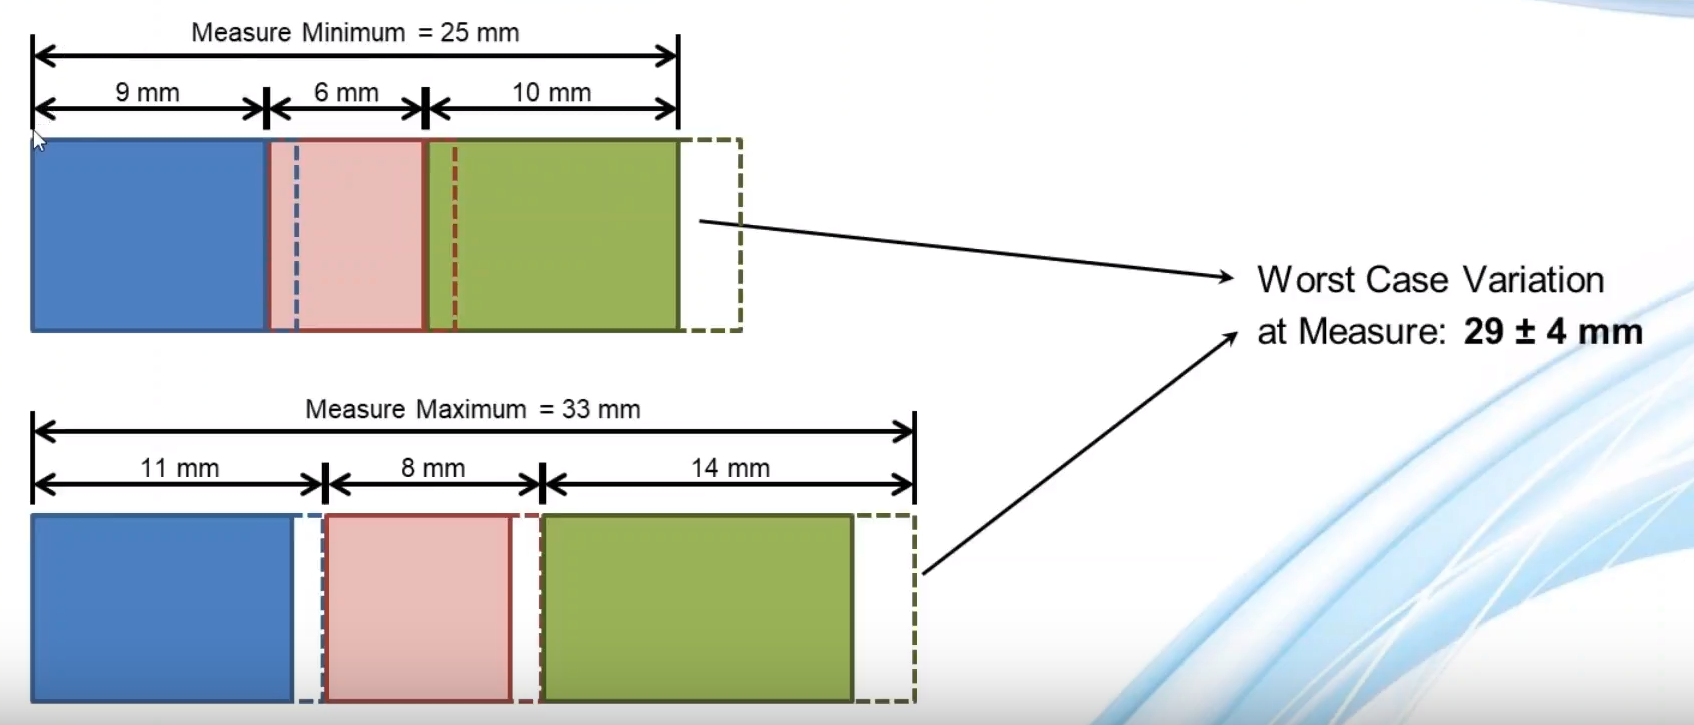
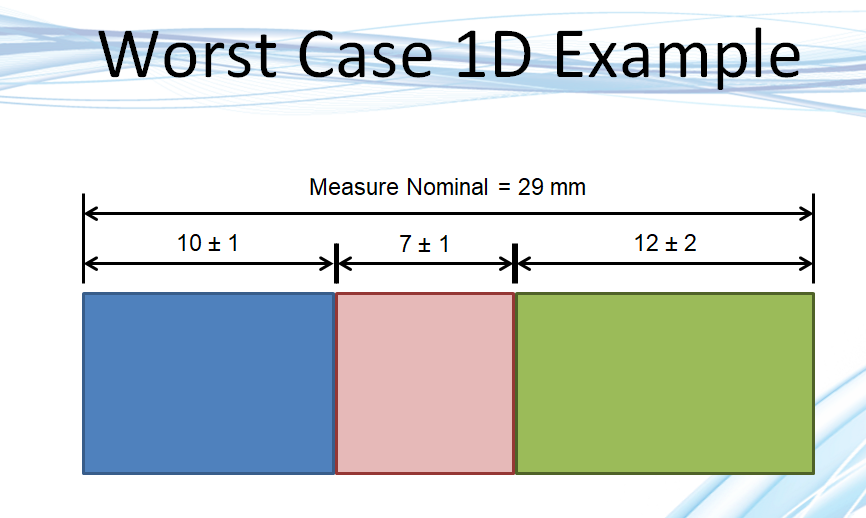
Worst Case Analysis - Each individual tolerance is set to a value in its range (typically a tolerance limit) where it will result in either the maximum or minimum output at a specific measured location.
A Worst Case analysis is the only way to guarantee that an assembly of good detail parts will not be out of specification.
This is important, as a True Worst Case scenario is statistically unlikely to occur. In most cases, this means designing to Worst Case is a waste of money, as you are accounting for a very large segment of scenarios that are unlikely to ever happen, and can be monitored for with basic in line measurement.
There are instances where products should be designed to Worst Case. These situations are usually related to safety concerns; medical devices (especially implanted ones!) and some vehicles require there to be a 0% failure rate, as people's lives may be on the line.
Though, for most products, a basic metrology and quality control strategy can catch any major out of specification components, and greatly reduce the cost to manufacture the product.
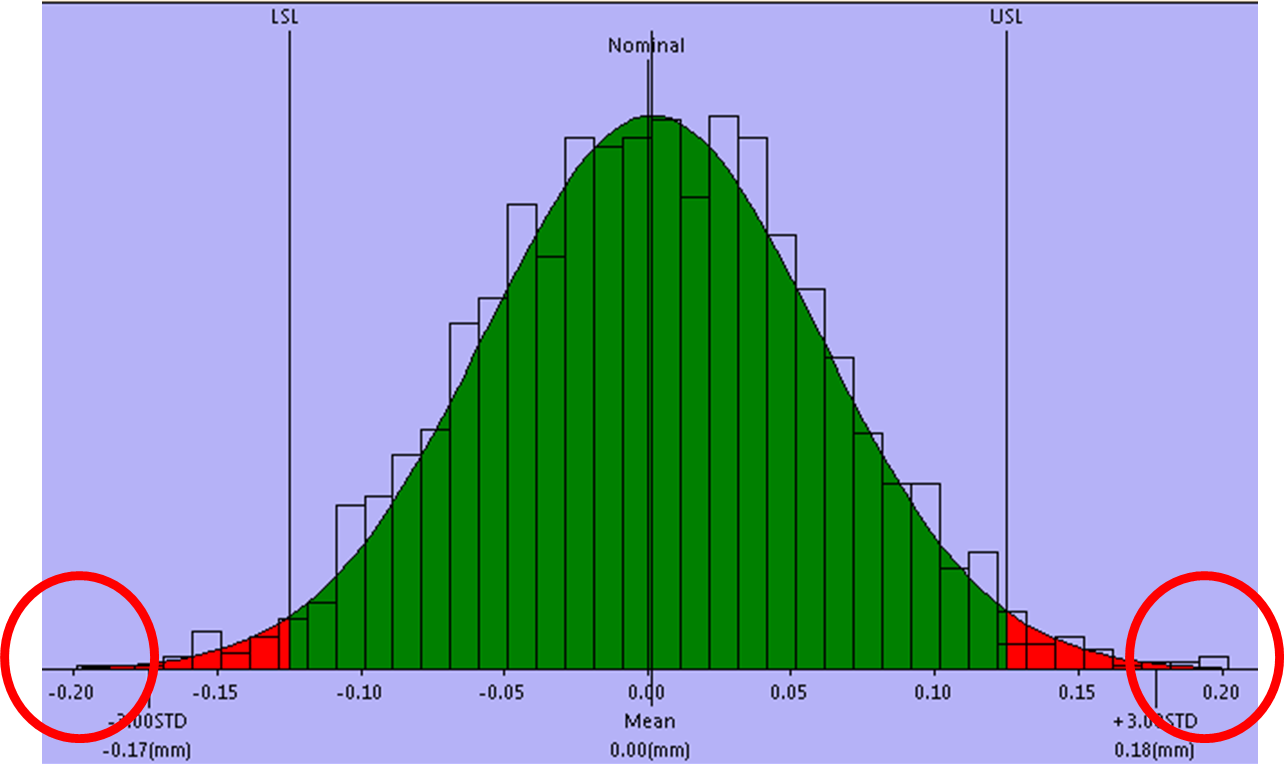
True Worst case situations are way out on the tails of statistical probability, becoming increasingly less common as the product becomes larger. Designing a product to 0.00022% of products can increase costs while not improving product quality in any significant way.
1D Shortcomings:
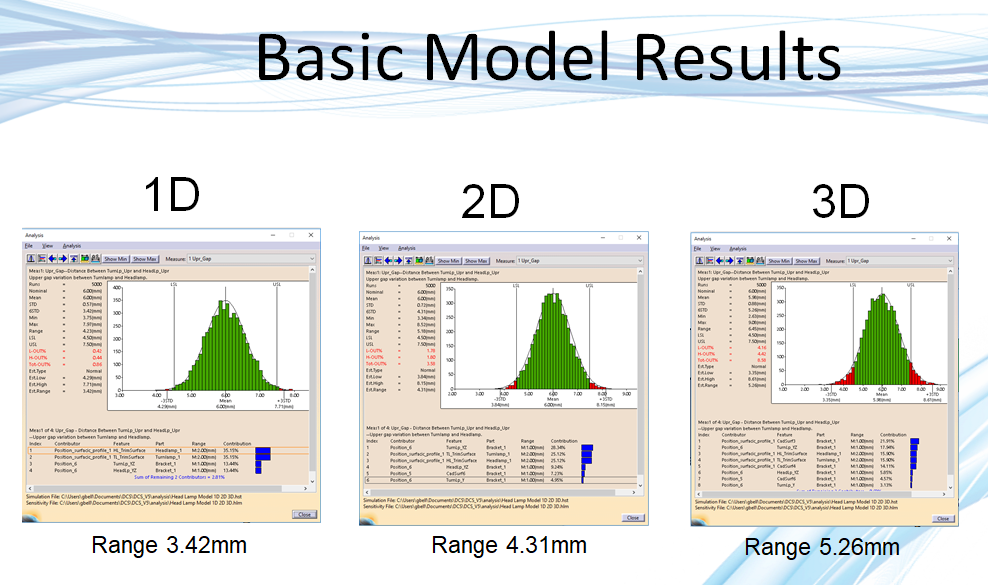
3D Advantages:
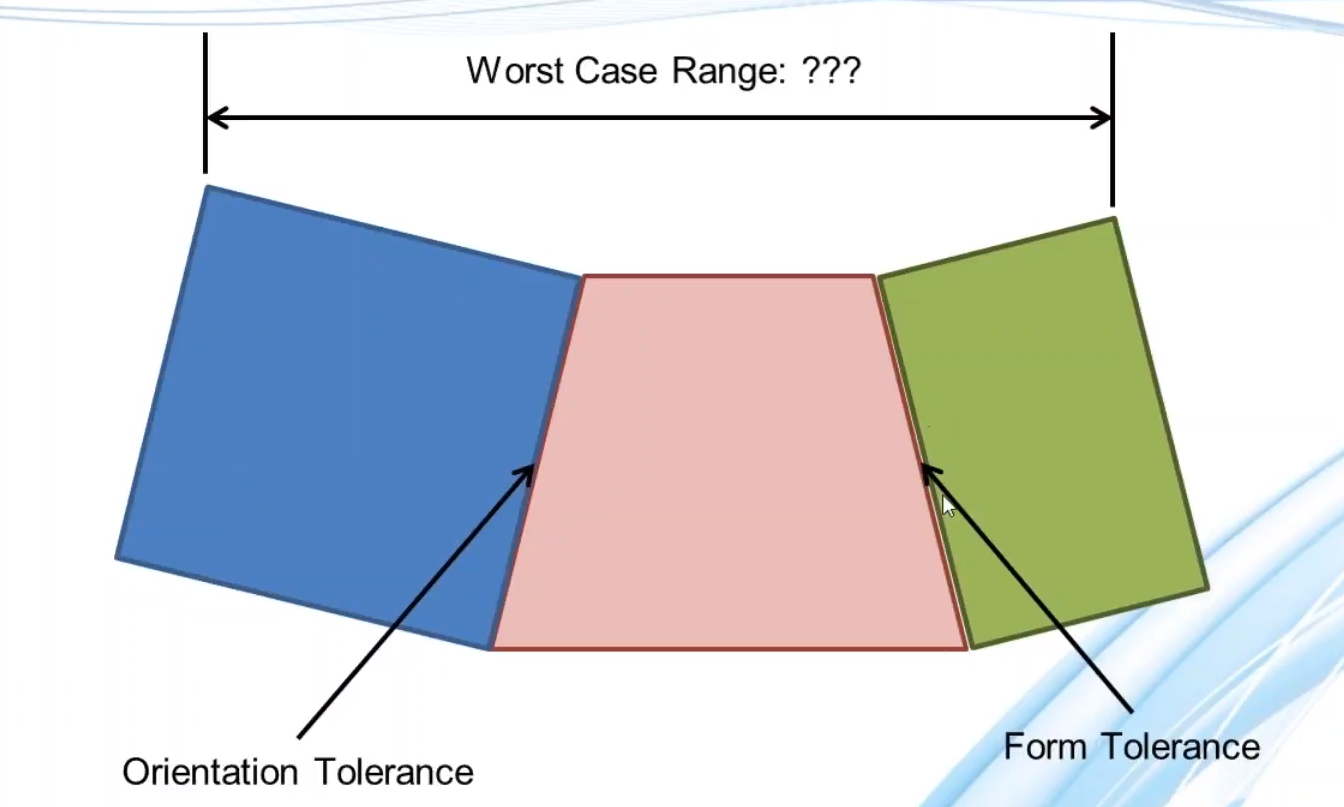
3D analysis takes into account form, orientation as well as accumulation of tolerances across the entire assembly. This can find variation and sources that users may not have expected to find. When doing 1D and 2D stacks, or stacks by hand, you have to include all suspected sources, while creating a model of the assembly with 3D variation lets you include and find sources you did not expect. This can be very valuable for determining risk in final production and solving manufacturing issues early.
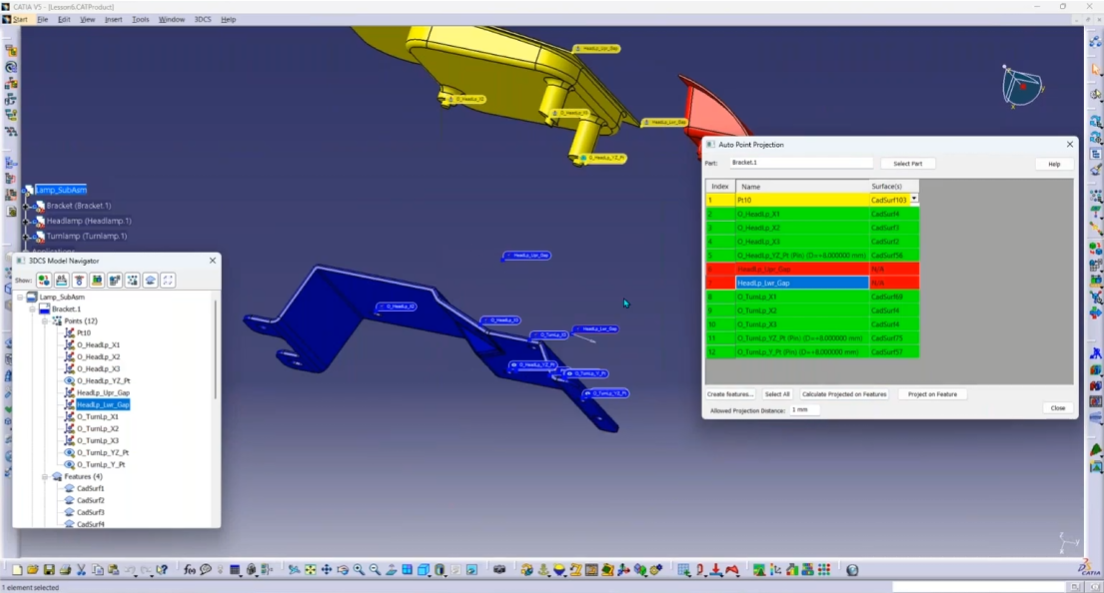
Here is a sample from the Webinar introducing the concept:

North American Innovation Center
28064 Center Oaks Ct A, Wixom, MI 48393
Call us: +1 (248) 504 6200


No Comments Yet
Let us know what you think