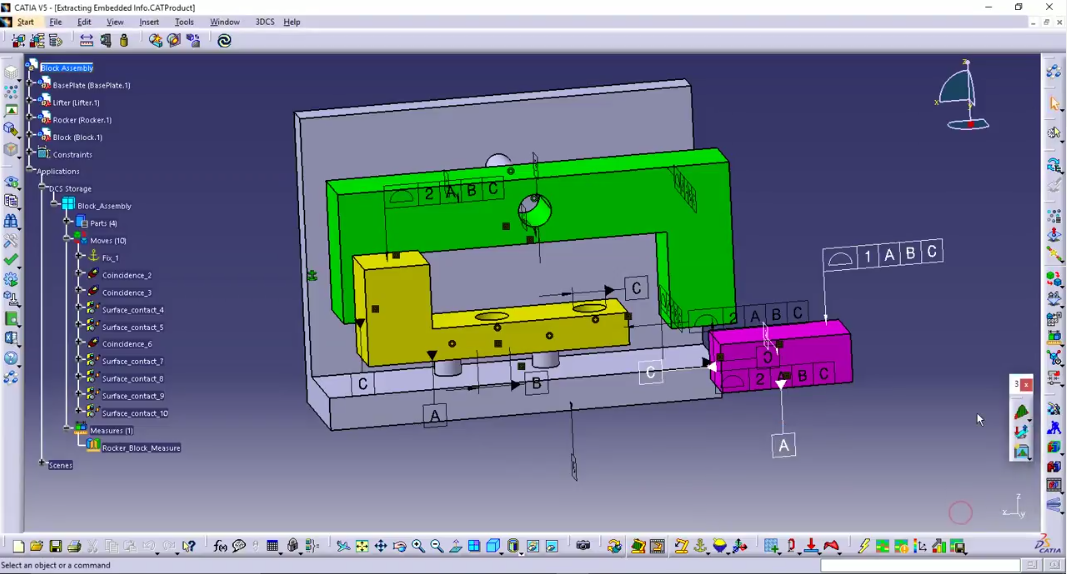
Excel can be used for a lot of equation based applications. Many companies rely on it for their tolerance analysis; doing 1D stacks and stack-up analysis using Excel macros and Visual Basic code. For basic cases, this works great and can be a fast and effective way to get answers quickly, but as soon as products, models and requirements become more complex, Excel falls flat.
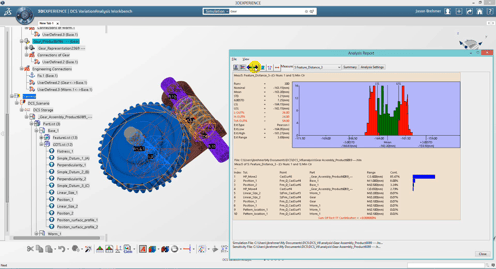
Integrated CAD tools give more accurate analysis results by incorporating additional influences
This means that your Excel answers might be misleading you, and can cause some embarrassing, and expensive, problems later on.
In what ways is Excel failing?
It is rare that all the parts in your product line up into a perfect linear line. Most often, there are parts arranged around your stack-up, and these part's tolerances will influence your linear stack. This 3 dimensional influence can cause more variation than you'd expect, and a 1D stack-up in Excel is not going to account for this.
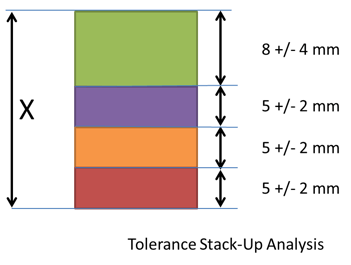
Even with a linear stack-up, you can have angularity that will cause additional variation, or variation and issues unaccounted for in your Excel stack. These 3 dimensional issues are related to the geometry of the parts, and require a CAD-based approach to properly simulate and validate.
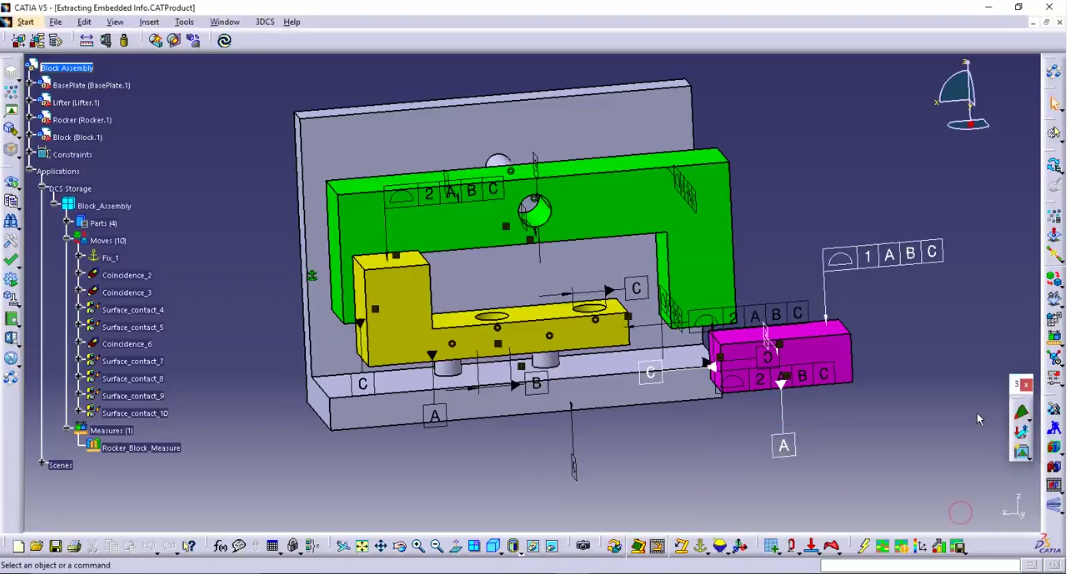
Not all scenarios can be calculated with an Excel 1D stack-up
An Excel stack assumes that all of the parts are assembled. Unfortunately, the presence of tooling, and the assembly process itself can add variation into a product. This isn't accounted for in Excel stacks, and requires a simulation of the assembly process itself, tooling and all. This can sound like an ambitious goal, but many tools on the market, like 3DCS Variation Analyst, offer tools to create virtual tooling, and assemble the product with CAD.
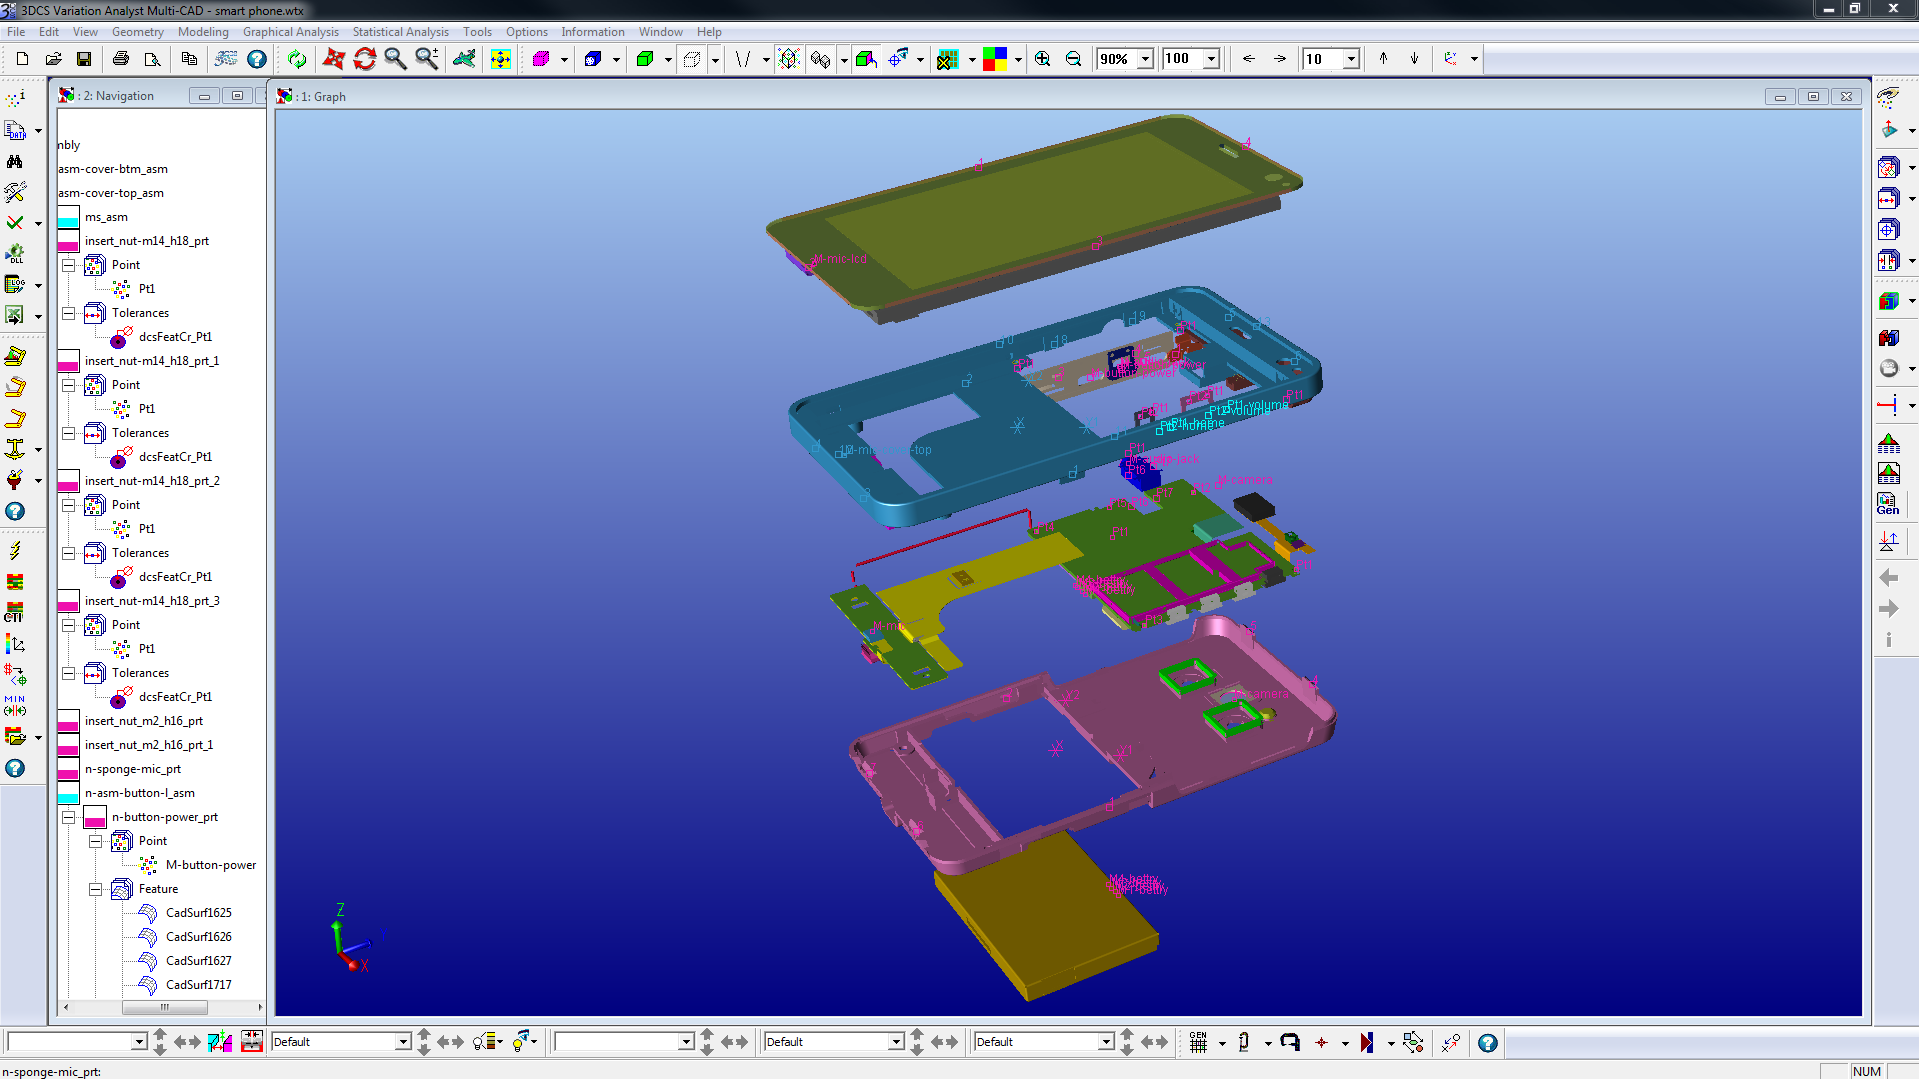
The assembly process itself can cause additional variation.
Additionally, Excel is not just going to leave our the assembly variation, but also the changes from adding or removing tooling. In many cases, tooling and fixtures can be very expensive, and with new processes like Determinant Assembly, it is important to test your process before ordering tooling and fixtures that could be removed.
A 1D stack-up generally uses a single instance for Worst Case. Most utilize the maximum tolerance, the uppermost limit, when calculating the tolerance stack. This 1D Worst Case is the very largest possible outcome for the given measurement, whether it is a gap or flush or profile condition. This scenario has two important issues:
This is the largest gap, but isn't the Worst Case, meaning, it isn't the scenario with the highest product failures. It may be the case that one tolerance at it's minimum, while the others are at the maximums, could cause a tilt or geometric change to the part that may be worse for pass/fail criteria than if the gap is simply at its largest possible size.
True Worst Case considers a range of possible combinations to determine the tolerance scenario that causes the greatest number of non-conformance, or percent out of specification. This is the scenario that will be the worst possible case, rather than a mathematical sum of tolerances.
The chance that all parts are manufactured to their extremes (maximum tolerance range), and then all of those parts are chosen for the same assembly is extremely small. Like 1 in 10 million small. This has a lot to do with the assumption of standard distribution, whereby most of the manufactured parts are going to fall within the range of tolerances around the median. This makes the scenario where all tolerances are at their maximum, together, an outlier on the longtail of a six sigma graph. Modeling your product and manufacturing on an outlier is going to increase your manufacturing costs exponentially, and only to account for a scenario that will statistically never happen.
A Worst Case tolerance analysis is the only way to guarantee that good detail parts will not be out of specification. The normal assumption (RSS) carries some “risk” that bad assemblies will be made from good parts. As mentioned above, because the probability is so low of actually occurring, the Risk is frequently managed via trend adjustments. If the trend can be perceived at a point where adjustment can be made, then additional Risk can be accepted and a process modeled for 100% success rate is not needed. Instead inspection and adjustment can be used as a less expensive option to tightening tolerances.
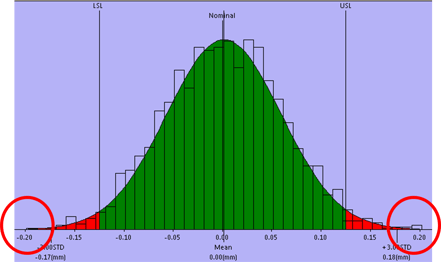
Please don't model your process based on these two scenarios!
What's more, with proper inspection, even rudimentary inspection, an outlier of that magnitude should be found during the manufacturing process and corrected, keeping it from ever leaving the plant.
The last on our list, as it is relates to some of the other items, and is more of a special case itself. Not all stack-ups are equal. As mentioned above under item 1, angularity and non-linearity in the stack-
up can cause additional variation that can only be simulated with a 3D simulation. Non-linear relationships are difficult to simulate accurately, because in many cases the tolerances influence one another, changing their actual range from the specified range, effectively causing tolerances to act with a magnification. This could cause your +/- 1 mm tolerances to have an effective range of +/- 1.2 mm, which may sound like small change when discussing car door gaps, but can have enormous impact when you are looking at the internal components of a phone, or a Pacemaker.
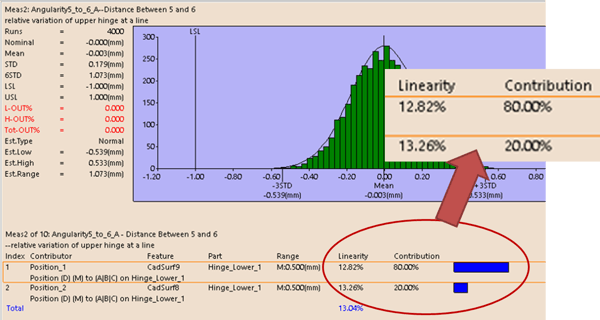
Non-linearity can throw a wrench into your equation.
These Stories on CATIA
Comments (1)