Fittingly, it was a doctor of physics working for a company known for its lab work -- Bell Telephone Laboratories -- who is credited with first using SPC techniques. But SPC concepts aren't on the fringe. In fact, they've been in use ever since Dr. Shewhart first developed his control charts at Bell Labs nearly 100 years ago.
SPC now is a definitive feature of the modern factory and is used far and wide across the spectrum of manufacturing settings.
 What is Statistical Process Control (SPC) then?
In short, it's a means for controlling variation in a manufactured product.
Variation might be a good thing in a restaurant, but in a manufacturing environment it's the devil product quality engineers are forever trying to shoo away. Manufacturing is all about precision and predictability; variation is the opposite of that. When parts come out off of a line with grossly different dimensions, that's variation, and variation is bad. After all, no automotive OEM ever expressed delight at the surprising number of ways its car doors fit (or didn't fit).
As customer expectations of quality have increased with time, so has the importance of SPC and related concepts of quality management, design and process control, and advanced product planning. As to be expected, SPC now involves plenty of digital horsepower. Sophisticated precision measuring tools are married with software to make the lives of engineers easier as they seek to meet narrower time and design constraints.

A CMM Machine for accurate measuring of parts (thanks to wikipedia for the image)
Or at least they're supposed to. One of the biggest issues facing product and quality engineers today is that while they possess the tools to measure products in an endless number of ways, they now have an endless amount of data. To make matters worse, they're largely still doing the measuring by hand -- a luxury suppliers can ill afford in a "just in time" world.
Automated measuring systems exist, but they are limited (mainly by cost) in the number of measurements they can take once up and running on a line. The challenge then is matter of prioritizing: Selecting which data points among the countless available are most important and building an automated system to suit.
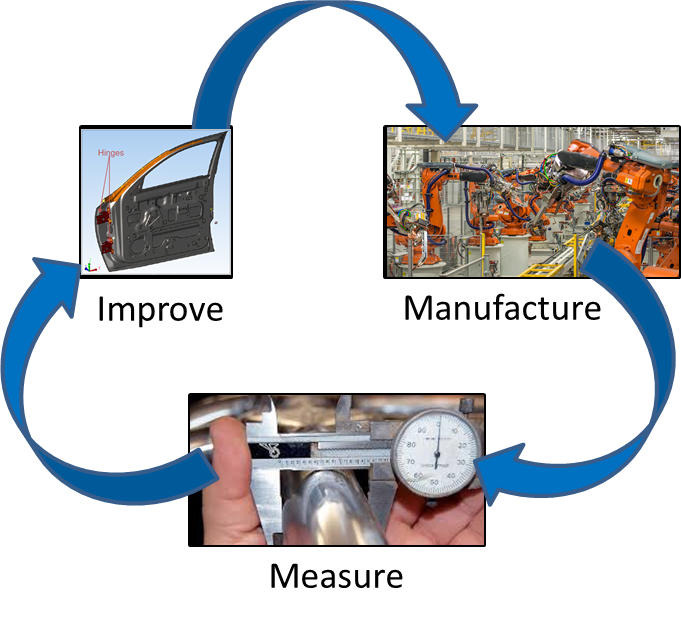
This allows for the development of a closed-loop system in which variation is constantly monitored throughout the manufacturing process, and used to constantly improve the process.

The digital horsepower for measuring parts has increased dramatically. The biggest change, though, is in cost. CMM machines and many metrology devices previously too expensive for any company shy of a multi-million dollar corporation to possess, are becoming less and less expensive. What this means is that more companies than ever before are measuring their parts and manufacturing processes. With so many companies measuring parts daily, oftentimes many times throughout the day, quality managers are stuck trying to figure out what to do with all of the data.
 This need to measure and collect data into big data sets has left a large vacuum at the end of the process; that of handling the large data sets. "Big data" is bragged about, with each part on the process being measured and huge stacks of reports being created, but it falls on someone to turn that data into real intelligence. That is, information that can be readily acted upon. Without this actionable information, the data is, in a word, worthless.
Think about it. If you are given data outputs from half a dozen different measuring devices, say two CMM's, two handheld gages, a Faro arm (these are great by the way), and a visual scanning device for point clouds, the outputs are going to be pretty different to start, which to those ingrained in the quality world is nothing new. However, the sheer quantity of data from all these devices for even a small production line is going to take time to go through and analyze, a lot of time.
Most companies implement QMS (Quality Management Systems) in order to handle all of the big data. This is of course different than a system tracking logistics, materials, suppliers, parts and billing. These kinds of systems are intended to track quality and apply quality intelligence to refine the raw data down into actionable information, that is, easy to use dashboards and reports that are constantly created and refreshed to give quality professionals a real time view into their manufacturing quality at all of the different levels: product, plant , part and companywide.
So let's get back to the heart of the matter. The problem we're talking about here is time, or the lack of it.
As mentioned before, the information is there inside the data. The question is, how much time are you willing to spend to get it? Being able to provide actionable information from measurement data should not take days and weeks, but it usually does. There are solutions for this.
DCS uses QDM, a modular system, to pull the information needed from big quality data sets and deliver it in a usable form, called Quality Intelligence. The idea is to have the information in real time, so that when a problem happens, quality engineers and managers:
This gives enterprises the ability to identify, root cause, and collaborate as issues arise, resolving them quickly with little to no downtime.
Three plants in different global regions produce parts, which are measured as they come off the line.
1. The measurement data is sent to a central server at the headquarters.
2. Quality metrics and reports are instantly pulled from the data to compare the plants, the products and processes to see the level of quality using metrics like cpk, ppk and percent of out of spec.
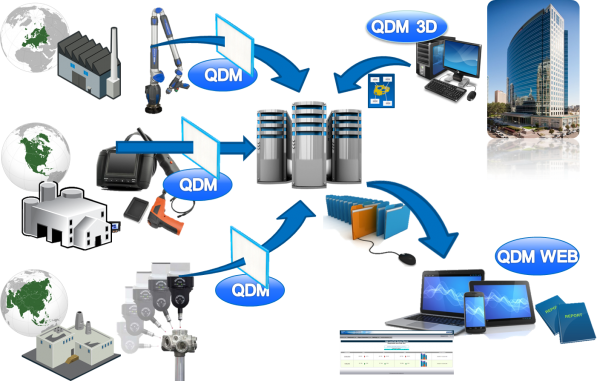
That information is them collaborated with suppliers and customersusing reports and dashboards. What kind of reports you say?
Probably some of these for starters:
a) Box plots for the inspection program
b) PDF's of existing custom reports from plant floors in 7 plants in 3 different countries.
c) Success/failure Report sent to specific contacts alerting to out of specification points from the last 24 hours (or 48, or 12, or 6, or 1 in many cases).
d) Update Statistics Reports ( %OK, Cp, Cpk at quick glance of inspection programs)
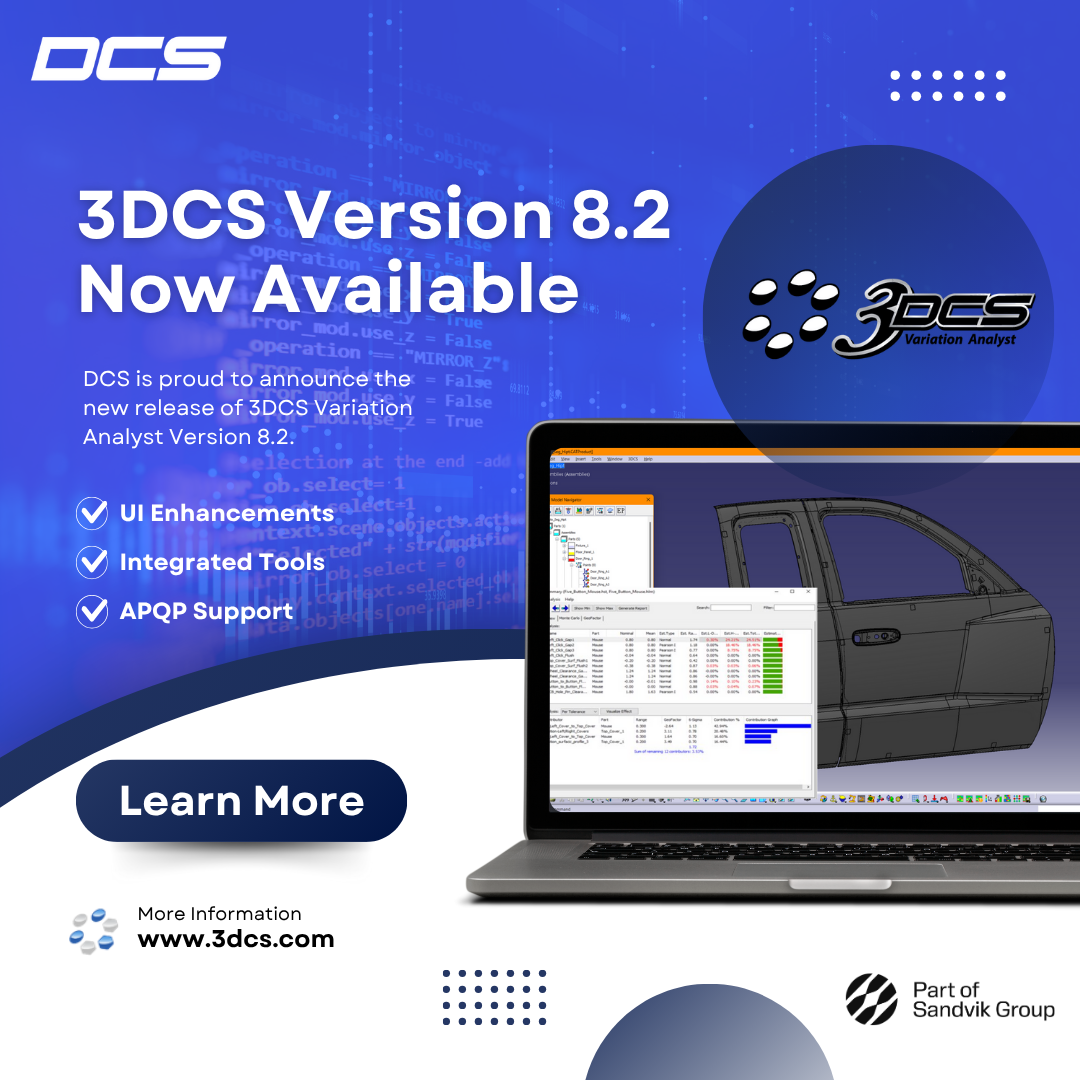
Take a look at DCS's approach to SPC with QDM
Let DCS provide a free demo to see if QDM can save you time.
Click to schedule yours
Click below to download the brochure -
Find out more at http://www.3dcs.com/qdm.html

North American Innovation Center
28064 Center Oaks Ct A, Wixom, MI 48393
Call us: +1 (248) 504 6200


No Comments Yet
Let us know what you think