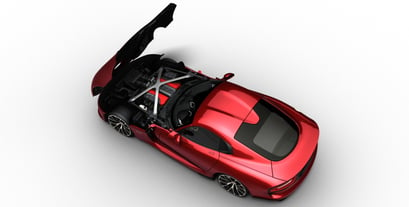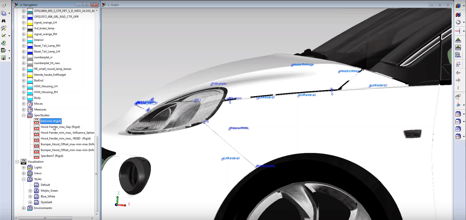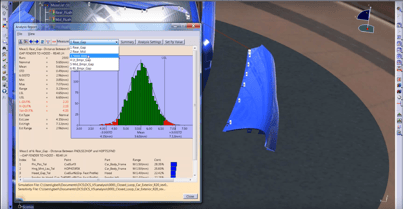
Part 3 of the Perceived Quality Series introduces different high-end visualization tools that can used as part of Spec Studies and Variation Studies to create life like images of your product.
Perceived Quality has become more valuable to manufacturing as OEM’s begin to understand that the perception of their vehicles’ quality is almost as important as the quality of their vehicles. With ratings given based on Perceived Quality, and teams dedicated to its application, it is clear that Perceived Quality Studies are valuable to cutting edge manufacturers.  Clearly, not every user will have access to the same tools. 3DCS and its integration into the CATIA 3DEXPERIENCE and CATIA V5, as well as the Visualization Export Add-on, give users the ability to incorporate their existing high-end visualization tools into their Perceived Quality Workflow.
This webinar will showcase three different tools that can be used with 3DCS Spec Studies and Visualization Studies:
1. CATIA 3DEXPERIENCE (CATIA V6) - Live Rendering
2. 3DEXCITE Deltagen - Ray Tracing
3. KeyShot - 3D Rendering
Join DCS for this free webinar to learn how to apply visualization to your studies to bring them to life. See how your product will look in different environments and lighting conditions, then add your design variation to see the impact.
Click to Learn More and Register
Why bother doing Perceived Quality Studies? Well,take a look at our earlier post about Perceived Quality and some examples in the 3DEXPERIENCE platform (CATIA V6). It shows some great examples and has a whitepaper available for download that was created through a partnership of DCS and Dassault Systemes.
 The first part of the series walks through the value and application of Perceived Quality with some industry examples, and then has a step by step walkthrough of creating a Spec Study in 3DCS.
In case you missed it, here is a link to the webinar OnDemand
View Perceived Quality Part 1: Spec Studies
 Part 2 showcased the use of tolerance analysis, 3D tolerance stacks, based on the manufacturing design (GD&T) of the product. Simulation Studies and high end visualization were then applied to the results in order to show what the variation would look like on the end product. This information can then be communicated with design and management to show worst case scenarios.
Here is the OnDemand webinar in case you weren't able to make it
View Perceived Quality Part 2: Simulation Studies
These Stories on 3DCS
No Comments Yet
Let us know what you think