Based on discussions and articles in the DCS Community - Register FREE to learn more
By Brenda Quinlan - DCS Senior Variation Analyst
DPMO is used to compare measures results. It is particularly useful when measure spec limits are between 3 and 6 standard deviations from the mean. For these measures, the actual percent out results tend to always be zero, so an improvement or a worsening of the results cannot be detected. In 3DCS, DPMO is calculated from the spec limits, mean, and standard deviation of the measure and assumes the measure is normally distributed. DPMO is equivalent to the percent of the area under the normal curve beyond each spec limit. The results can be verified by using a Z-Score table.
Est. DPMO uses the equation for the estimated curve type instead of assuming the measure is normally distributed.
A Z-Score is the number of standard deviations a particular value is from the mean. In 3DCS, it is calculated from the DPMO result. For any particular DPMO value there is a unique Z-Score. The results can be verified by using a Z-Score table.
Typically, 3DCS results represent long term variation. When Z-Scores are used, however, typically short-term results are desired. Therefore, a Z-shift (Z0) value is defined in the Preferences to convert a long-term result to a short-term result. A typical value for Z-shift is 1.5. This indicates that over the long term, the mean is expected to shift about 1.5 standard deviations. Z-shift is added to the calculated (long-term) Z-Score to get the displayed (short-term) Z-Score value.
The estimated Z-Score is calculated with the same method and using the estimated DPMO result.
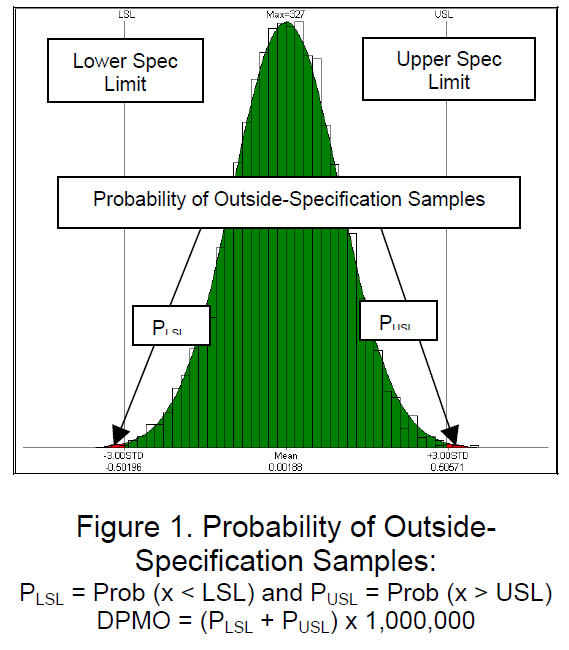
Defects Per Million Opportunities (DPMO) is a very important criterion used in Six- Sigma programs. Typically, the objective in a Six-Sigma program is to control the production/ service process within a 3.4 DPMO [Dimensional Engineering News, September 2003].
Based on Probability Theory, DPMO is directly related with the probability of outside- specification samples. It is important to notice that a Normal (Gaussian) distribution is assumed when calculating DPMO in a Six-Sigma program (see Figure 1).

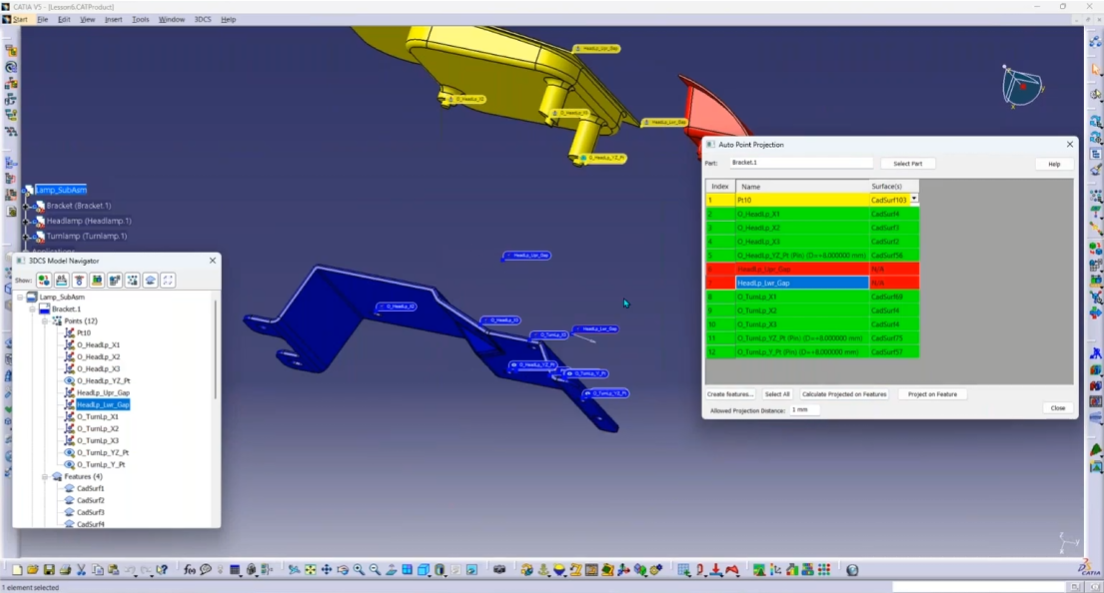
3DCS® is a statistical tool providing a wide range of statistics. DPMO is one of these statistics (see Figure 2). The DPMO calculation in 3DCS® is detailed as follows.

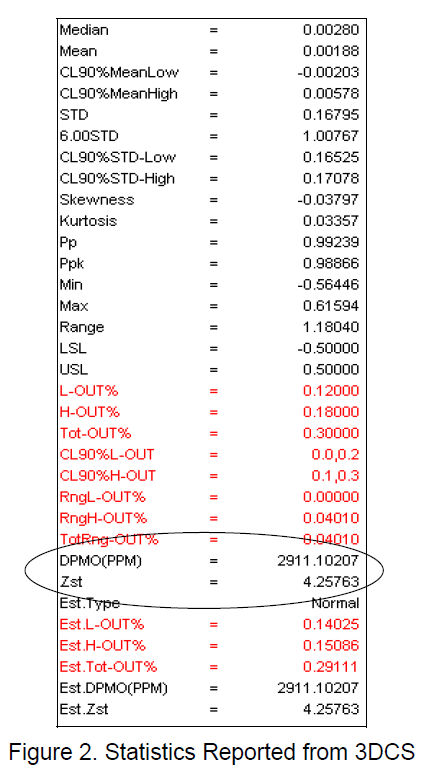
Theoretically, if enough samples are taken from a Normal distribution data set, the relationship between the total-out-percentage (Tot-OUT%) and DPMO should be
DPMO = Tot-OUT% x 10,000
In practicality, with limited samples of 2000, the equation above is just an approximation.
Since the assumption of a Normal distribution is used in calculating DPMO, the question of usefulness arises when the samples are not normally distributed.
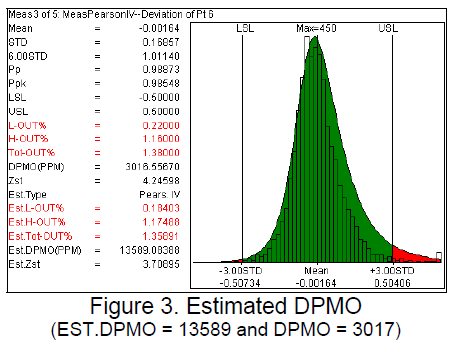
From 3DCS®, an estimated DPMO (EST.DPMO) can be used for this case. EST.DPMO is calculated from the estimated distribution type, instead of an assumed Normal distribution. See Figure 3.
In a Six-Sigma program, Zst is used as a checking measurement for a process capability.
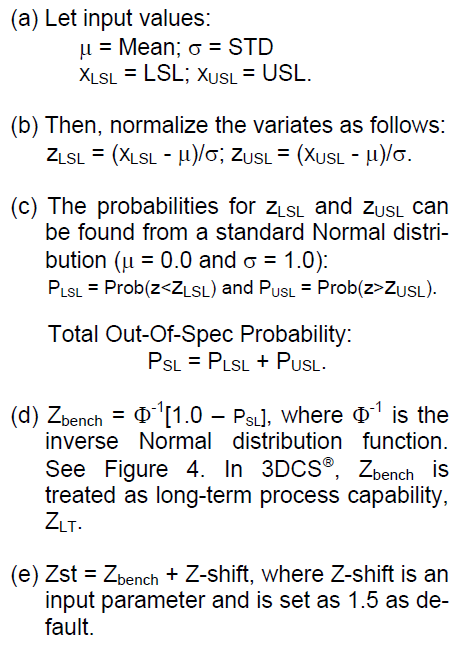
To directly calculate a Zst from Out-Of-Spec, see [Dimensional Engineering News, August 2004]. The following is the Zst calculation used in 3DCS®. The calculation is based on the assumption of a Normal distribution.
(Referenced from MiniTab 18 Support-- https://support.minitab.com/en-us/minitab/18/help-and-how-to/quality-and-process-improvement/capability-analysis/supporting-topics/capability-metrics/z-bench-as-an-estimate-of-sigma-capability/)
You can use Z bench values instead of the Cp and Pp capability indices to describe the sigma capability of a process with measurement data.
You can use Z.bench values to describe the sigma capability of your process. Because they are based on a standard normal distribution, Z.bench statistics are benchmark values that allow you to easily compare process capability.
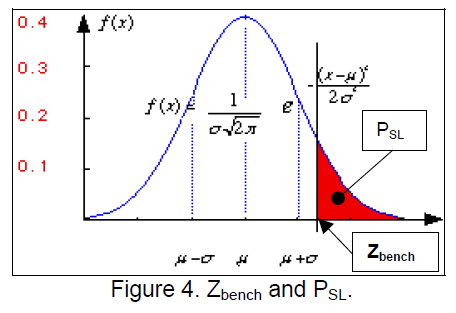
To understand Z.bench, consider all the defects of a process, which usually fall on either side of the specification limits.

If you put all the defects on the right tail of the distribution, and then measure the number of standard deviations from the center to the point that defines the total defects, you obtain the Z.bench value.

Interested in more? Visit the DCS Community to read articles, discuss topics and learn about tolerance analysis

Contributing Editors:
Ying Qing Zhou,
Thagu Vivek,
Victor Monteverde,
Earl Morgan,


North American Innovation Center
28064 Center Oaks Ct A, Wixom, MI 48393
Call us: +1 (248) 504 6200


No Comments Yet
Let us know what you think