
Thursday August 6th, 2015 at 11:00 am EST
Our second part of the 7.3.2.0 series covers new updates to Color Mapping and the Process Capability Database (PCDB). Color Mapping lets you view variation on your model and quickly determine key areas and trouble spots. The Process Capability Database (PCDB) let's you create a database of known material and process tolerances that can be applied to your model with a few button clicks. This let's teams standardize their tolerance sets to reflect actual manufacturing data, and then update any of the tolerances within the model by simply uploading a new database (excel .CSV file).
The second part in our 3DCS Version 7.3.2.0 series, this webinar focuses on two existing features in 3DCS: Color Mapping and the Process Capability Database (PCDB).
Both of these tools have been updated, adding usability and quality of life improvements.
This webinar is a great way to learn what's new, but also, to see how these two features can be applied to your current projects to speed up modeling, or give better insight into your model.
Available as part of the base 3DCS Variation Analyst Suite, these two features come standard with every installation of 3DCS Version 7.3.2.0.
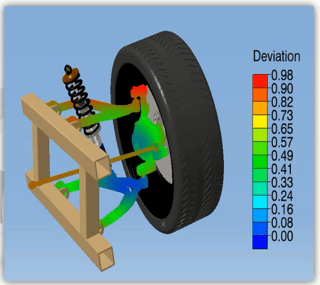
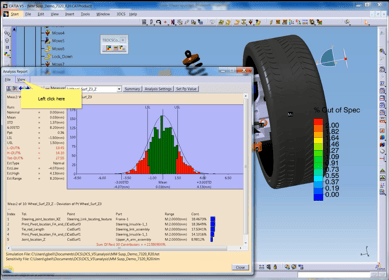
Color Mapping gives you the ability to choose parts of your assembly, or the entire assembly, and visually see the effects of variation as color coded patterns. With a manual or automatic legend, you can decide which specs determine problem areas and which do not, then see where you need to focus your attention and the areas of greatest variation. Helpful for fast identification, this tool is also very good for presentations, making it easy to understand outputs and analysis for managers and team members without having to go through specific outputs and metrics.
There are two primary methods of color mapping in 3DCS Variation Analyst: Color Map Shading and Color Map Lines.
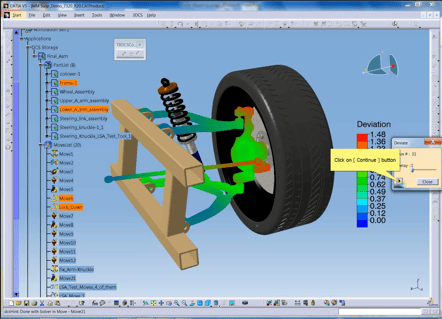
Color Map Shading
Color map shading colors parts based on their deviation. The legend can be set manually or can be allowed to float, automatically setting itself to the largest tolerance in the selected area. As you can see in the images below, the frame and the tire were not selected fro color mapping. This let's the user focus on the main areas, without slowing down the process by including extra parts.
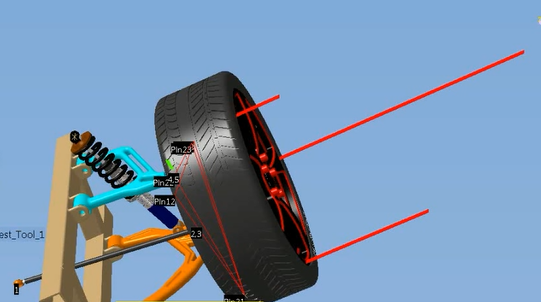
Color Map Lines
This shows the variation or selected statistical metric as lines at the given tolerance points. These lines are colored and lengthened based on the point’s variation. This allows you to quickly find critical measures that contain the largest amount of variation. When bringing your measurement data back into 3DCS, or testing possible builds, this method is a powerful root causing tool. As part of that methodology, it can also be used to compare multiple data sets, such as two iterations, as well as simulation versus actual measured data or even two different assemblies measured at the plant.
The goal of the Process Capability Database is to make your modeling faster and more accurate by representing realistic materials and processes, and standardizing them across your team. By using historic data or a knowledge base, you can create a database organized by material, process and feature type that accurately reflects real tolerance process data. This allows the user to quickly create tolerances by applying the information in the database onto points and features. In addition, the tolerances can be linked to GD&T and information in your database for quick and easy reference later.
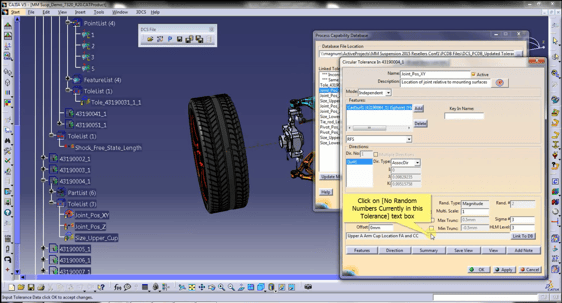
Looking for a simple method of creating your Process Capability Database? You can import your measurement data from a CMM or other measurement device. This method can be streamlined with QDM 3D, a standalone reporting module from DCS. With a text output from your measurement devices, quickly populate and utilize your database, and speed up your modeling.
Below is a sample PCDB. You can see drilling holes and milling machine tolerances, as well as material options.
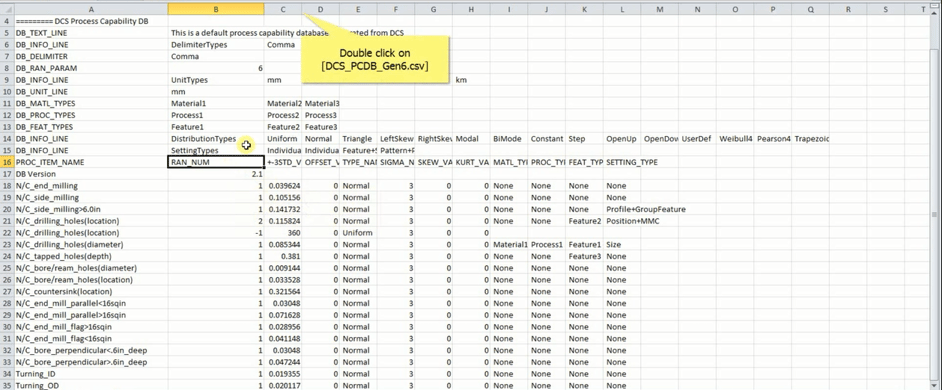
The PCDB makes modifying tolerances faster as well. Simply change your database and update it to update all of the linked tolerances. Manufacturing acquire a new machine that ca hold a tighter tolerance? Change in the database and see it instantly reflected on your model.
Event Date: Thursday August 6th, 2015 at 11:00 am EST
Join DCS for this free webinar event. Can't make the event? Register to get the recorded session.


North American Innovation Center
28064 Center Oaks Ct A, Wixom, MI 48393
Call us: +1 (248) 504 6200


No Comments Yet
Let us know what you think