 Dimensional Engineering and Dimensional Analysis can be daunting tasks. Sometimes, the biggest issue is finding out just where to begin. DCS's software, 3DCS Variation Analyst, used for dimensional analysis and tolerance analysis, shares a similar issue. As a robust and indepth tool, it can sometimes be challenging to figure out where to begin.
It all comes down to Moves, Tolerances and Measures, but what are those in relation to a model? What do I actually have to do to get a result? What results do I get?
In order to help customers and clients quickly understand the premise of 3DCS Variation Analyst, the team at DCS has developed a new video series to explain the software's fundamentals.
These videos help break down the parts of a 3DCS Model, what goes into and what comes from it. Perfect for new users and those interested in working with the software, these short videos will give you a good idea of what to expect, and how to get started with 3DCS Variation Analyst.
Here are the first two videos:
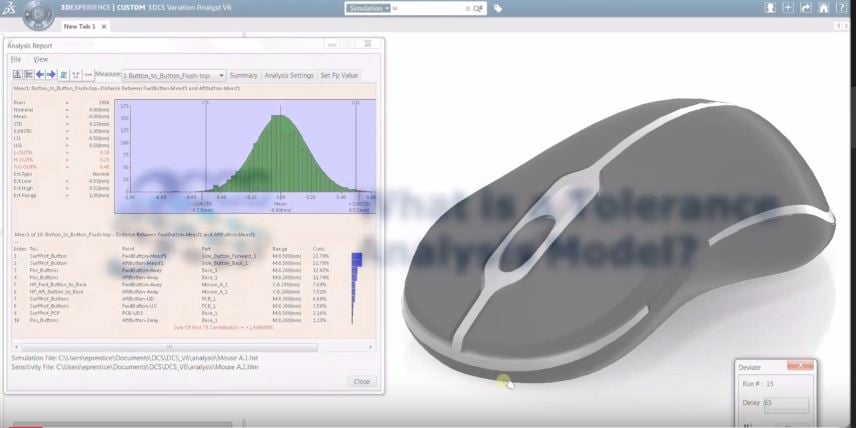
A dimensional variation analysis model is a simulation of an assembly to predict the amount of variation resulting from piece-part tolerances and process sequence. In addition, a variation analysis simulation helps to determine the key contributors to that variation. 3DCS is a dimensional analysis tool for performing variation analysis simulations. It works by replicating the build process with deviated parts in a virtual environment.
The deviations come from tolerances randomly varied within specified ranges and distributions. 3DCS simulates building thousands of assemblies to generate a statistical output for each measurement. The software analyzes every tolerance's contribution to variation. The simulation results provide critical insight to identify strengths and weaknesses of a design. This insight is essential for revisions that drive improvement in your results with greater consistency.
The purpose of a tolerance analysis model is to understand how part and assembly tolerances affect the overall build and fit of a final product. There are three main types of results that can be obtained directly from a tolerance analysis model in 3DCS: a Monte Carlo simulation, a "High-Low-Median" sensitivity analysis, and a GeoFactor geometric effects analysis. All three analyses provide different information for assessing product quality.
The Monte Carlo simulation (an industry standard) predicts what percentage of builds will fail to meet critical quality characteristics. The High-Low-Median analysis, or HLM, and GeoFactor analysis both identify which tolerances are contributing the most to those failures. HLM analyzes the contribution based on the total range of a tolerance. GeoFactor analyzes the contribution based on part geometry. A combination of these three results provides the necessary information for tolerance, design, and process optimization. These optimizations can lead to reductions in assembly time, re-work, material waste, and costly rework of tooling.
View the entire series by visiting the DCS Website here (no inputs or forms, promise!):
http://www.3dcs.com/getting-started-3dcs-dimensional-analysis.html
Thanks for visiting our Blog!
Regards,
Ben Reese
DCS Marketing
These Stories on 3DCS
No Comments Yet
Let us know what you think