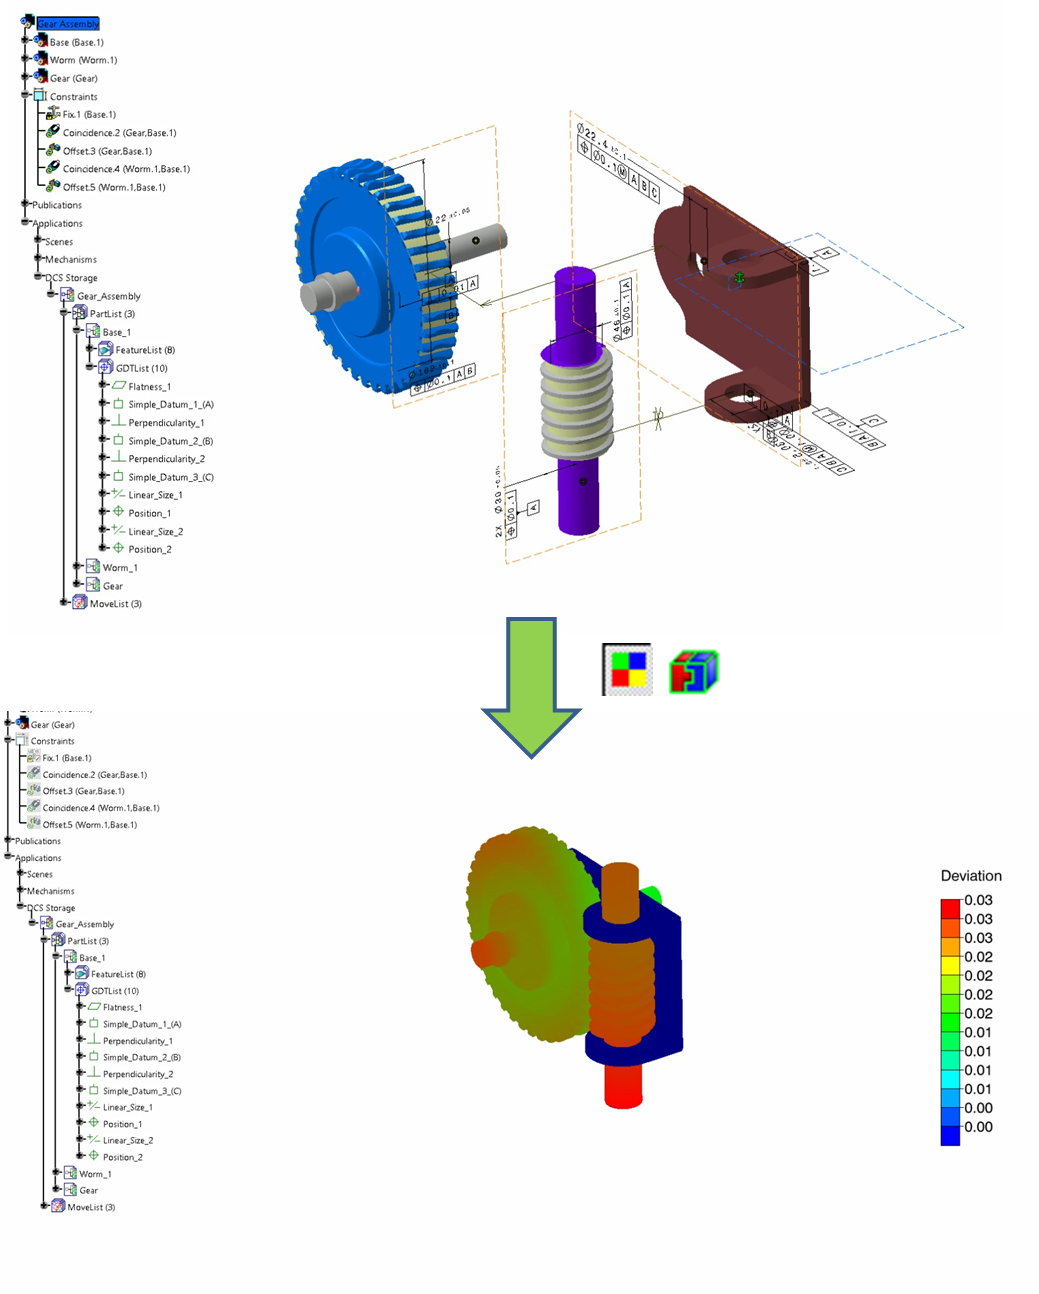

Color Contour (also known as Color Mapping) is a visualization tool which shows the level of variation on parts during Deviation and Simulation. It allows a user to pinpoint part and assembly tolerances, and measurements that are most critical to the assembly process.
 How do I start using the tool?
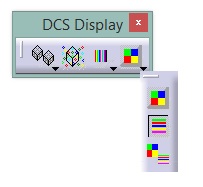
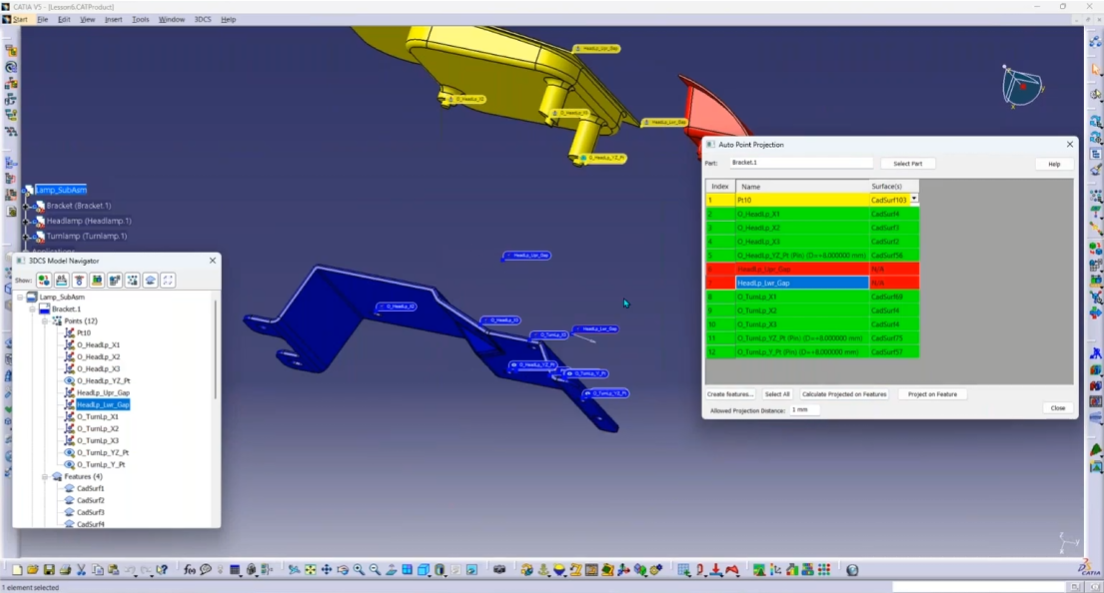
No crayons or color pencils are required but a 3DCS Variation Analysis license is needed to run 3DCS. To apply Color Contour, the user will need to locate the 3DCS Display Toolbar and activate Color Contour. Once the user activates Color Contour, Multi-CAD, CATIA V5 and 3DEXPERIENCE require a specific visualization type. This is automatically changed in the software and will produce a warning to show the user it changed. Open the Color Contour options to activate the legend.
Note: A user can have both a Simulation window open and show Deviation by either clicking in the Graph window or the Simulation window.
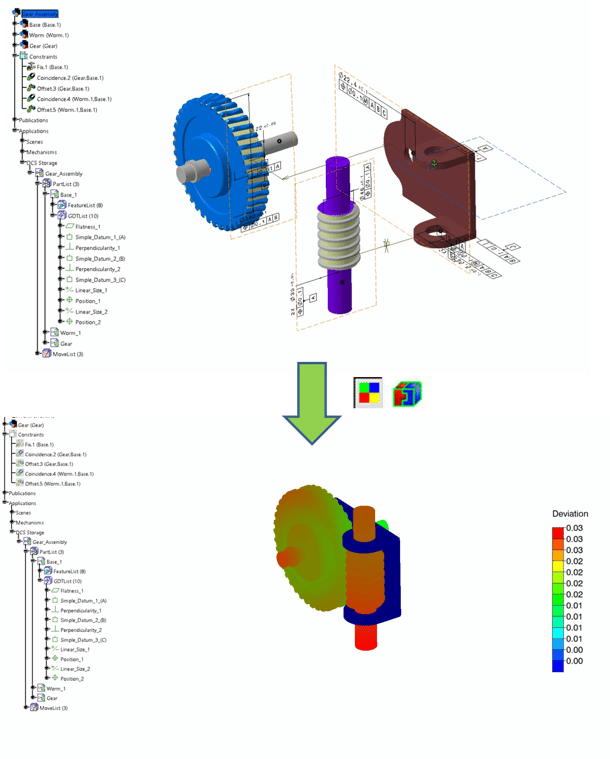
A user can use Color Contour instantly, once the model requirements are met. Using Color Contour can be an alternative to running a Simulation, to visually verify part tolerances meet requirements, or to quickly show colleagues and managers out of spec areas. However, using Color Contour while deviating, depending on model size, can cause lag in the model. Color Contouring specific parts or sub-assemblies instead of the entire model can greatly reduce the strain on your hardware.
While in a Simulation, use Color Contour to display all measurements that are Out of Spec or the Estimated Range. These options can be set in the Color Contour options dialog. This is a useful function that shows the whole Simulation of the model in the legend and is presented visually on the model.
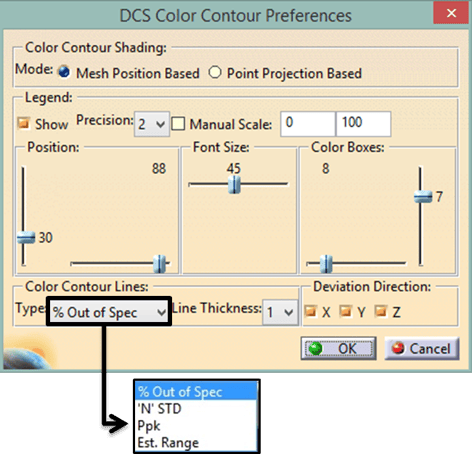
Here’s a bit more about the Preferences and legend display. Most of the display changes can be found in the Preferences dialog box.
This Tips and Tactics is here to get you up and coloring with Color Contour. More information about Color Contour is available on the Community.

Find more Tips and Tacts at DCS’s blog at http://blog.3dcs.com.
Sign up for DCS's newsletter (http://www.3dcs.com/mailing-list.html) to get each month's Tips and Tactics and DE Focus right to your mailbox.
Questions? Call or email DCS, and we’d be happy to help.
DCS Dimensional Control Systems
580 Kirts Blvd ste 309
Troy, MI, 48084
(248) 269-9777

North American Innovation Center
28064 Center Oaks Ct A, Wixom, MI 48393
Call us: +1 (248) 504 6200


No Comments Yet
Let us know what you think