What is the Cost of Quality (CoQ):
Many definitions and models define CoQ. The most straightforward is the one identified by the American Society of Quality (ASQ), as follows:
An organization’s CoQ is actually the cost of NOT creating a quality product or service.
Every time work is redone, the cost of quality increases. Obvious examples include:
As stated by Jim Smith in the June issue of Quality Magazine, "Quality is measured by the price of nonconformance (PONC)."
In short, any cost that would not have been expended if quality were perfect (zero defects) contributes to the cost of quality.
Over the years, while reams of research and resources have focused on how to achieve quality in manufacturing, there has been less of a focus on the relative cost of quality and even fewer discussions on how to optimize costs while achieving quality goals.
Within the academic community, there has been valuable discussion and debate on how to measure and manage the Cost of Quality (CoQ). Yet, no matter how great the interest of the academic community in CoQ models is, and how much theoretical information and practical advice can be found, the situation in the real world is different. The majority of the existing CoQ models focus on the following four components, which are most easily understood and measured in the real environment of manufacturing:
Regardless of how an organization chooses to measure CoQ, one thing that virtually all researchers and industry analysts agree on is the value of identifying and fixing quality problems early in the manufacturing process in order to minimize the overall cost.
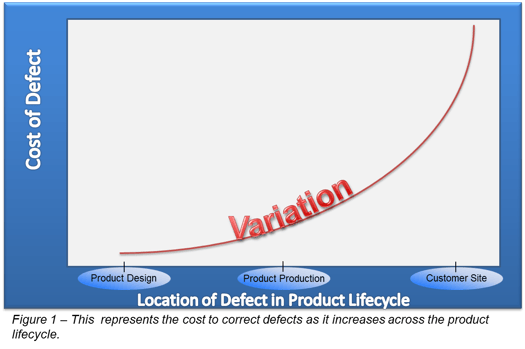
In fact, CoQ increases exponentially across the product lifecycle. Industry experts agree that the earlier in the product lifecycle that an organization establishes and clear-cut quality goals, and begins measuring and managing to those goals, the lower the overall costs.
 The relationship between timing and cost is illustrated in the figure at right.
“Affordable quality” is defined as the situation where quality goals are achieved at the lowest possible cost. This assumes the following:
Managing the cost of quality should be viewed as an ongoing process vs. a single event. In the right environment, measurement data and knowledge contribute to continuous improvement in the balance of cost and quality over time and across all aerospace products and programs.
 The most successful aerospace manufacturers use simulation-based dimensional engineering processes as a critical component of their overall quality management program in order to address quality problems before they occur.
Simulation-based analyses prevent problems that might not otherwise be discovered until manufacturing finds them or – worse – the end customer experiences them as quality issues.
With the use of tolerance analysis that is linked to actual measurement results, aerospace engineers can quickly pinpoint sources of variation and perform root cause analyses to solve problems – taking time-consuming guesswork out of the equation.
Nearly all aircraft built today are subjected to 3D-model-based tolerance analysis. Tolerance analysis helps product design and manufacturing engineers understand dimensional fit characteristics and quality statuses of composite materials, fastening operations, and assemblies. Engineers use this type of analysis before they start a product launch and continually through production.
This is not new or revolutionary. However, in a “Closed-Loop” DE process, there are several built-in steps that enable engineers to define and refine their plans and objectives early in the process, and through ongoing checks and balances, in order to achieve the precise quality required by the customer at the least possible cost.
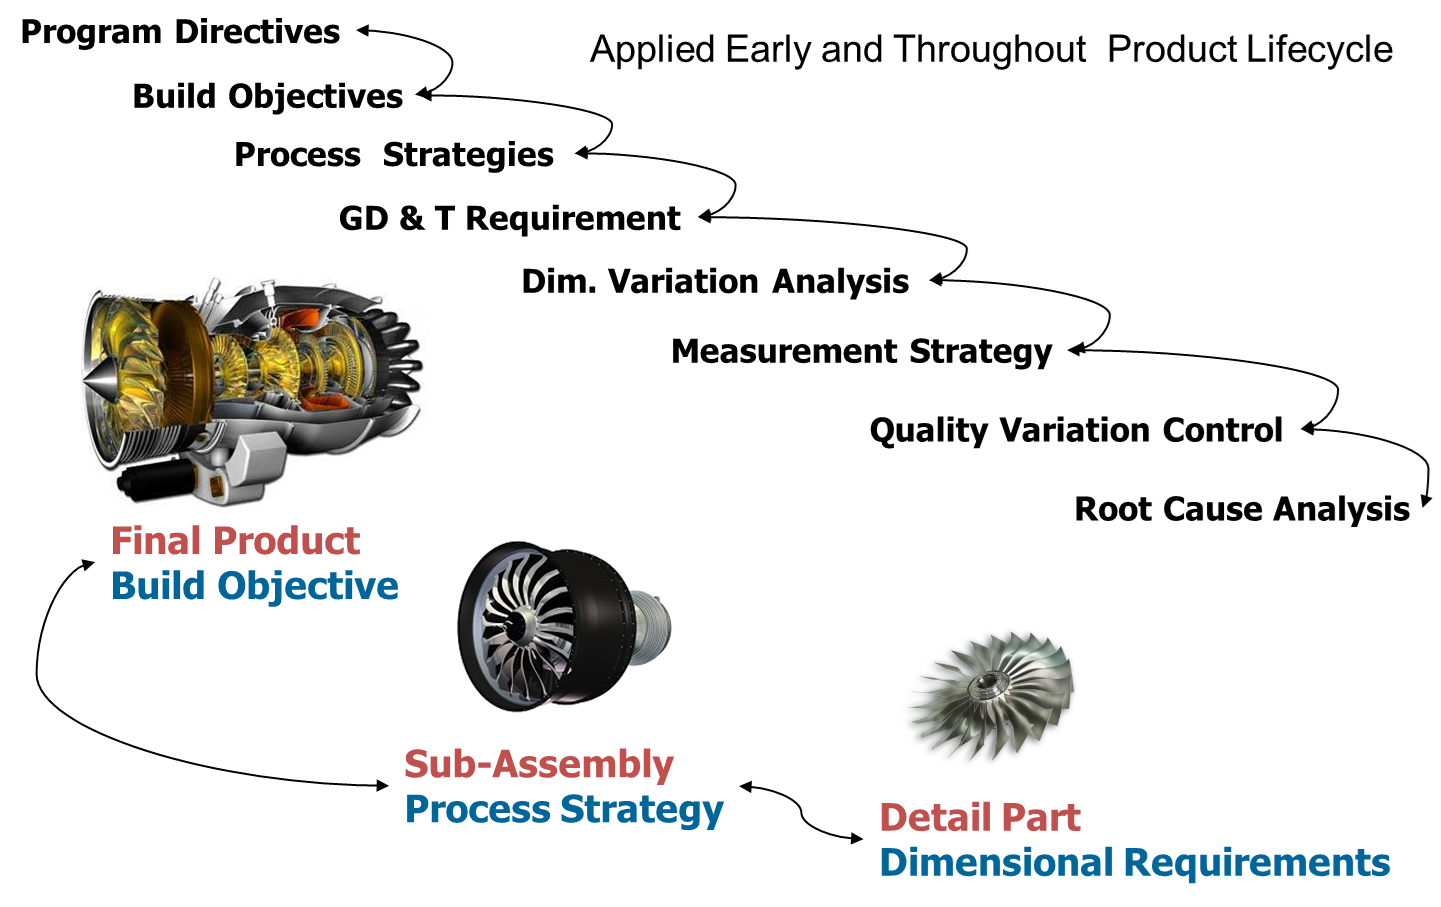
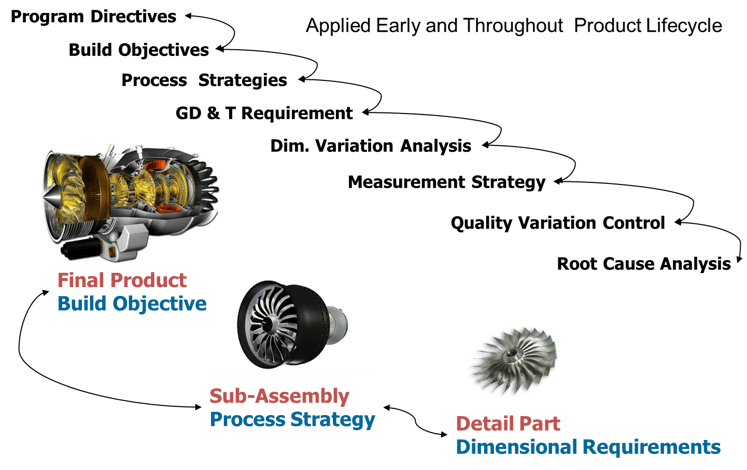
There are eight steps involved in a closed-loop quality management process.

Before establishing a formal closed-loop quality management process within an organization, it is essential that management not only buys into the concept, but also understands that the process should affect not only the design engineers, but everyone from purchasing agents to quality inspectors to manufacturing engineers. It is also critical that management drives the plan for how simulation-based tolerance analysis and dimensional engineering processes are used across the organization so they are applied in a way that allows the manufacturer to set and achieve quality goals while keeping cost to a minimum.
The first step in the development of any product is the establishment of build objectives. A cross-functional team analyzes the quality levels of competitor products in order to determine the appropriate levels of variation allowable for the products. The balance between build requirements and cost will vary based on the particular quality levels of the product.
Once build objectives are set, the product team develops and documents build strategies for how the product will be assembled, including all relevant fastening points and operations. The build strategy defines the way parts will be located within the assembly or fastening, which is also the way the parts must be held in their checking fixtures. There is always more than one way to manufacture, fasten and assemble parts and products, and the team’s goal is to find the most appropriate approaches given the quality and cost objectives associated with the product. For instance, one build strategy may lead to a very high quality product with very low tolerances, yet the associated cost does not meet the cost goals.
At this point, geometric dimensioning & tolerancing (GD&T) is applied to parts, fastening points and subassemblies, taking into account the build objectives and strategies. Through GD&T, best understood as the “language of dimensional engineering,” data locators are set, and all related dimensions are then measured based on their location relative to the locators. Measurements are identified by symbols defined through universally accepted GD&T standards used and interpreted by design, quality, and manufacturing engineers.
In a development phase, the abilities of all parts to be assembled and fastened must be ensured before production release. In a production phase, the possible product and process changes must be optimized before expensive tooling or fastening changes have been executed. Tolerance analysis produces neutral, realistic facts for the decision-makers. Tolerance analysis is performed in parallel with the setting of build strategies and GD&T requirements.
The next step in the closed-loop quality management process is the establishment of a measurement plan to identify the key critical quality characteristics identified through tolerance analysis. This plan documents tolerance limits for each part, fastening point, subassembly, and final assembly of the finished product. The plan is used in quality inspection labs as a roadmap of what critical features need to be checked and monitored during production. This process provides for a coordination of measurement points from the individual detail component, through sub-assemblies to the final product.
As the product enters pre-production and initial runs begin, quality inspection data for parts, automated fastenings and sub-assemblies is collected and dimensional data reports are generated. This ensures that measurement plans are being followed and that the end-products achieve the tolerances expected based on the results of all prior steps in the process.
The final stage of the closed-loop quality management process involves the review of dimensional data reports and root cause analyses of any quality issues. As has been the case at most other stages, if the end products and fastenings are not achieving the tolerances expected, engineers can loop back to find out where problems originated and either resolve any issues or adjust build objectives, build strategies, or tolerances as needed.
The closed-loop approach is referred to as such because it closes the loop on aerospace product and manufacturing. It enables engineers to use comprehensive virtual simulation for composites and automated fastening operations. They can analyze variation and tolerances in product design from initial product development through production, ensuring that the value of the analyses is maintained across the full product lifecycle.
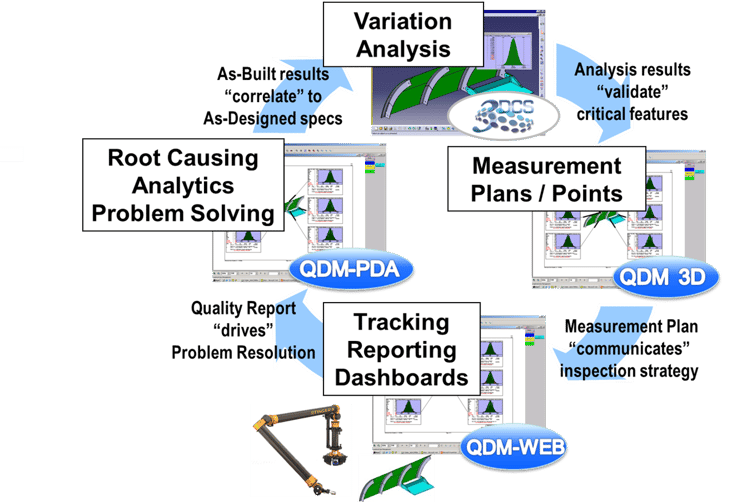
Through the eight-step closed-loop quality management process, dimensional quality data reports are generated as the product enters preproduction and initial runs begin. Engineers refer to the reports and check key points to ensure that measurement plans for the detailed parts are being followed and that end products achieve the quality targets expected based on the results of all prior steps in the process. With these results, they are able to quickly conduct root-cause analyses of quality issues as they arise. If the end-products are not achieving the quality expected, engineers can “loop back” to find out where problems originated and initiate corrective actions as needed.

Figure 2 - This is a representation of a closed-loop system.
Technology tools allow manufacturers to thoroughly appraise design, assembly and fastening robustness by quickly evaluating GD&T, assembly tooling and build/fastening sequencing – all well ahead of production release. The tolerance simulation identifies areas of concern, potential failure rates, and statistical results for each measurement, such as percent out of specification. A sensitivity analysis then looks at each tolerance as it relates to each measurement, and it identifies the percentage contribution or affect on each measurement.
Such tools rely on these critical measurements to create measurement plans and generate measurement reports, steps 6 and 7 of the “closed-loop” quality management process. The plans and reports define which critical-to-quality characteristics are to be inspected for dimensional variability and the results of the inspections.
By relying on virtual simulations throughout this process and feeding measurement inspection data back into the tolerance model, engineers can quickly pinpoint issues and perform corrective actions -- avoiding the need to chase problems through their build or automated fastening processes by trial and error.
Many factors can contribute to an increased cost of quality. The main ones are:
The “closed-loop dimensional engineering process” and the tolerance analysis tools that support such a process comprise a technology-driven approach that drives these forms of waste out of the process in order to achieve affordable quality.
The EDAG Group, a major aerospace supplier, stated during a tolerance analysis workshop that a closed-loop quality management process is one of the most effective methods to reduce so-called product lifecycle costs (PLCC).
EDAG engineers and quality professionals noted that, if they did not apply a thorough tolerance analysis process across their vast number of programs, their PLCC could easily increase to ten times the cost of following such a process.
A closed-loop quality management process as defined in this paper enables the aerospace manufacturing enterprise to avoid unnecessary costs involved in achieving quality. Users of such a process are able to achieve affordable quality by addressing all four components of the CoQ as follows:
In short, the use of a “closed-loop” quality management process, including tolerance simulation tools and techniques, enables engineers to optimize the balance between cost and quality.
These Stories on 3DCS
No Comments Yet
Let us know what you think