Edited 2-11-2015 for clarity
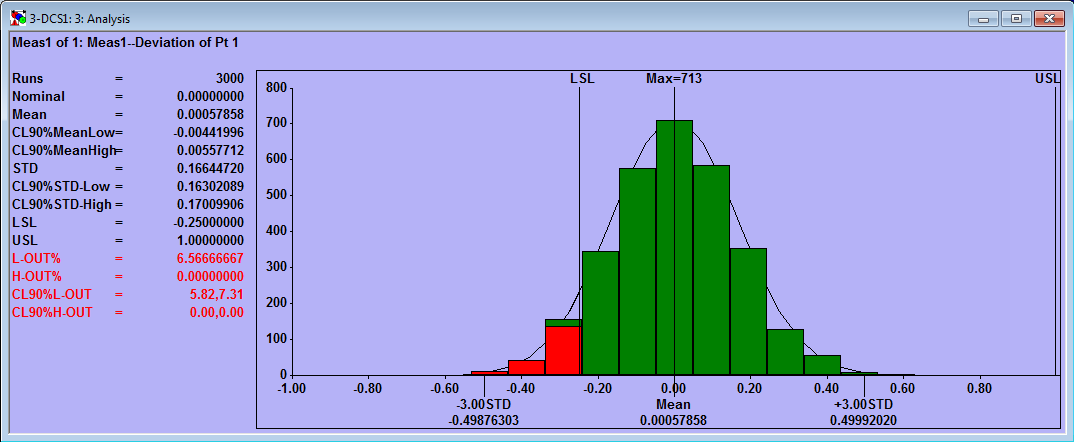
3DCS calculates Confidence Intervals for the Mean, Standard Deviation, High Percent Out (percent of runs above the Upper Sec Limit,) and Low Percent Out (percent of runs below the Lower Sec Limit.)
The Mean, Standard Deviation, High Percent Out and Low Percent Out values apply to a certain set simulation results. If the initial seed, the number or runs, or the model is changed, then the values of these statistics will change.
If a simulation had an infinite number of runs, then the Mean, Standard Deviation, High Percent Out and Low Percent Out values would converge to fixed values. Since the values include every possible run, they are now referred to as parameters and the infinite number of runs is the population.
The confidence interval is the range of possible values for the parameter based on a set of data (e.g. the simulation results.) The confidence level (e.g. 90%) is the probability that the interval contains the value of the parameter.

For example, the measure above has 6.57% of its runs below the Lower Spec Limit (197 out of 3000.) With the confidence level set to 90%, the population Low Percent Out is expected to be within 5.82% and 7.31% (out of infinite samples.) More samples would need to be run to better predict the Low Percent Out value.
How to Quickly Calculate Your Confidence Interval?
Here is a quick method to calculate your confidence interval
1. The confidence interval helps the user decide whether or not enough simulations have been run. If the confidence interval is too large for the particular application then it indicates that not enough simulations have been run. The size of the confidence interval will decrease as the number of simulations increases.
2. The confidence interval helps the user assess the validity of the curve fit. If the estimated percent-out-of-spec values do not fall in the confidence intervals for the actual percent-out-of-spec then curve-fit may be poor. Please note that the curve fit can be good for one side of the curve and poor for the other.
3. Determining if a change in simulation results is significant. Some changes to a model are significant, such as doubling the range of a contributing tolerance. Some changes to a model are insignificant, such as changing the initial seed. In the latter case, the simulation results will change slightly but will be equivalent. The slight changes are sometimes referred to as noise. So, given two sets of simulation results, 3DCS users often have to determine whether the differences between them are significant or insignificant. If the results of one simulation are within the confidence intervals of the other, it is a good indicator that the differences are insignificant. Please note that we cannot say how confident we are that the differences are significant or insignificant as this is an “off-label” use of the confidence intervals.
So, how many simulations should you run to be confident in your results?
Find out in the follow-up articles:
"How Many Monte Carlo Simulations Should I Run?"
Where Is DCS Getting These Numbers?


North American Innovation Center
28064 Center Oaks Ct A, Wixom, MI 48393
Call us: +1 (248) 504 6200


No Comments Yet
Let us know what you think