Click Here to Watch the Webinar On-Demand
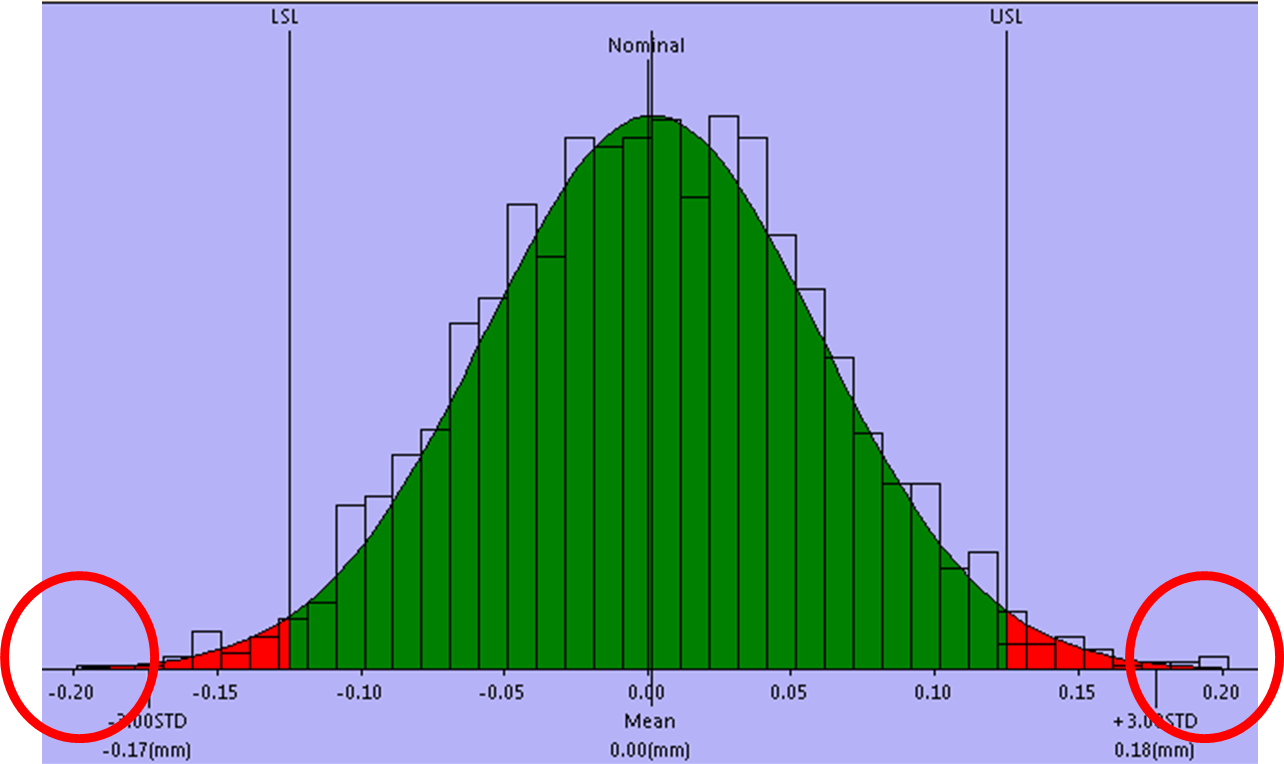
Worst Case tolerance analysis is where each individual tolerance is set to a point in its range (typically a tolerance limit) where it will result in either the maximum or minimum output at a specific measured location.
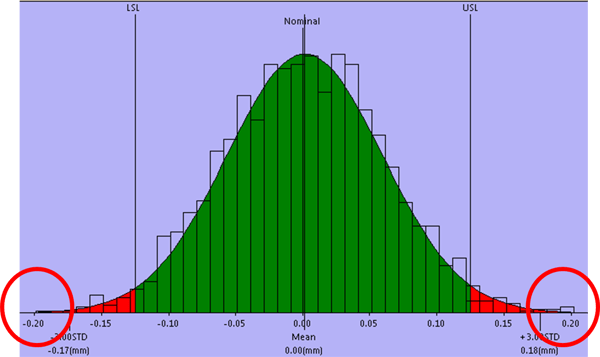
A Worst Case analysis is the only way to guarantee that an assembly of good detail parts will not be out of specification. However, in most cases, a statistical analysis gives the results needed to make decisions and reduce manufacturing costs.
Learn how 3DCS calculates, analyzes and answers Worst Case tolerance analysis.
Find out about:


2805 Bellingham
Troy, Michigan, USA 48083
Call us: +1-248-269-9777


No Comments Yet
Let us know what you think