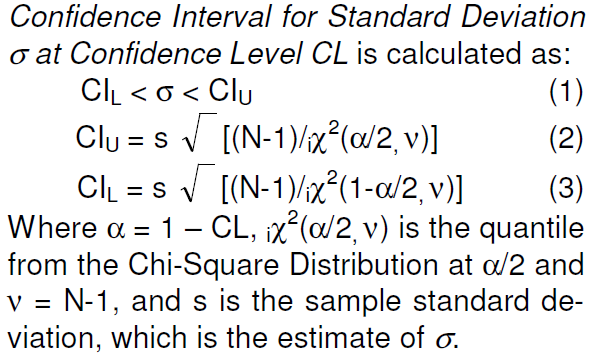
How do you know your results are accurate? Here are some methods of calculating your Confidence Interval
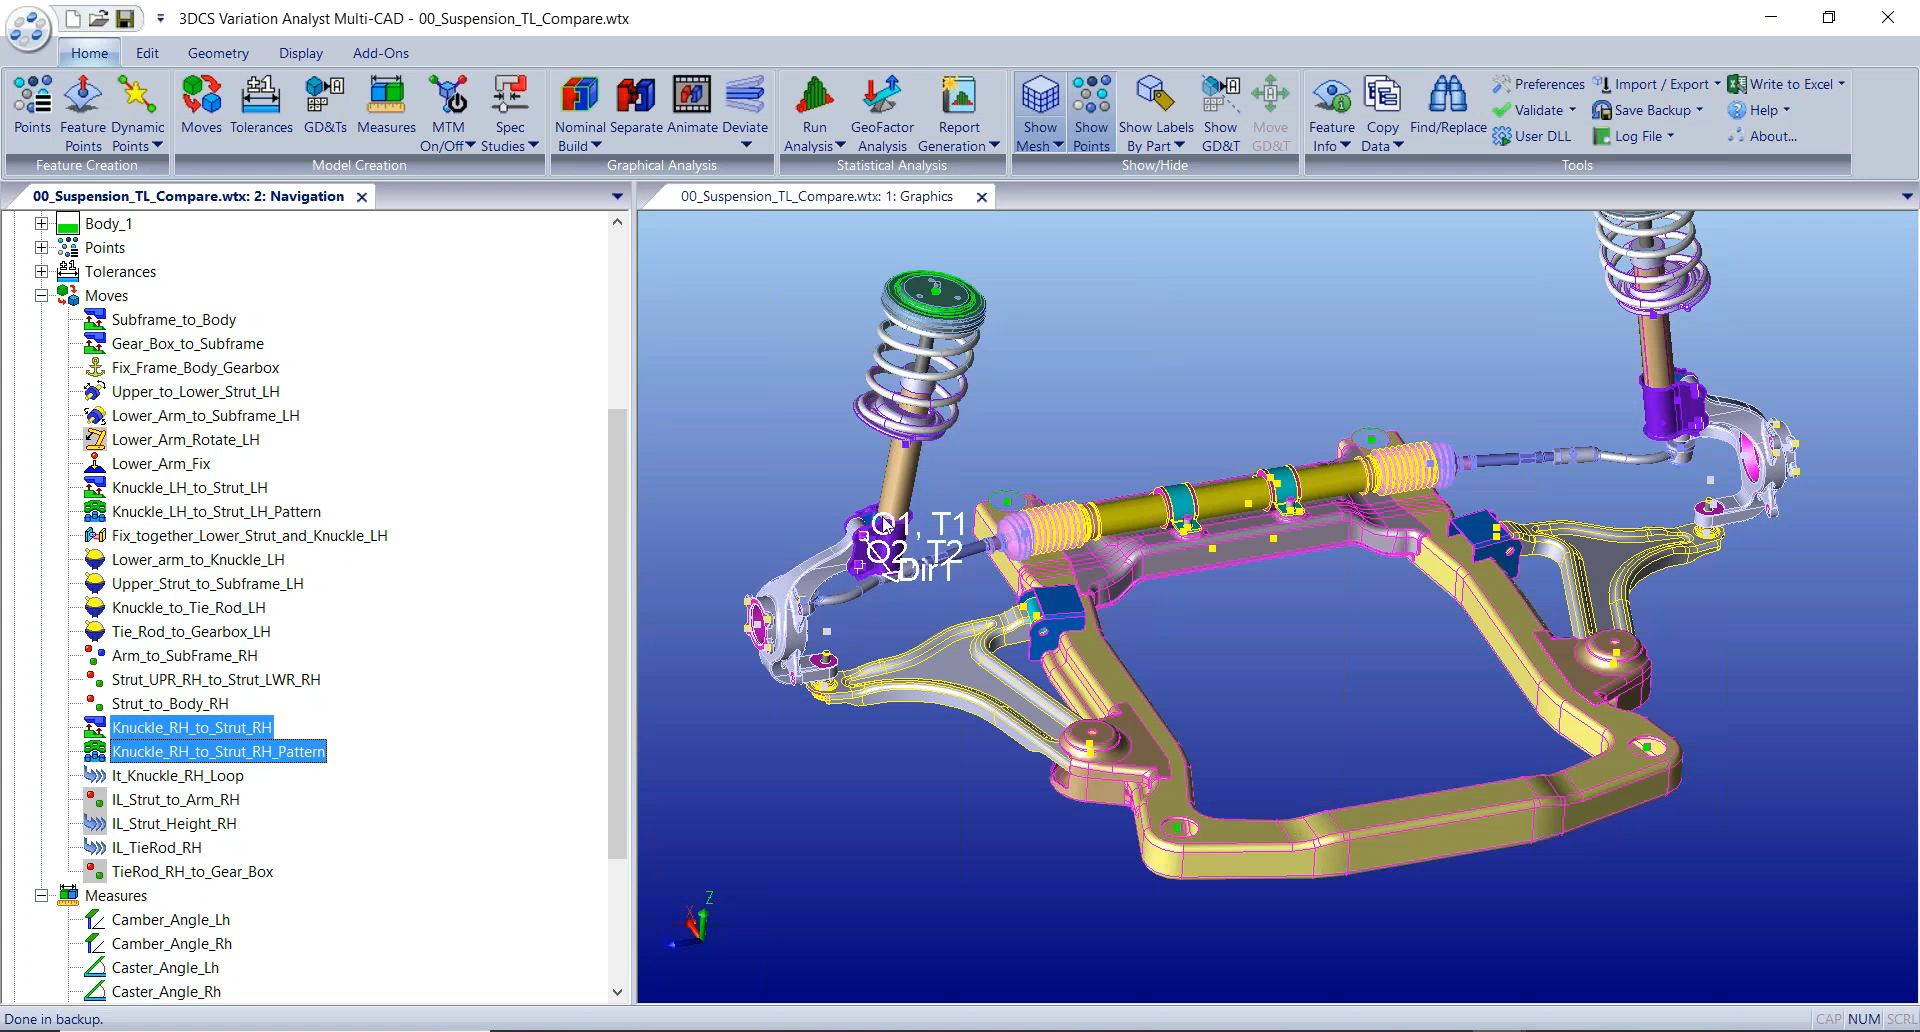
Dimensional Control Systems 3DCS® is a variation analysis tool that uses Monte Carlo simulation to predict the results of a set of measurements [Dimensional Engineering News, June 2009]. After a variation model is built in 3DCS®, a Monte Carlo simulation can be performed to provide the following statistics:
Descriptive statistics - calculations made directly from the sample data such as mean, minimum, maximum, standard deviation, percentage out-of-spec, confidence intervals, etc.
Inferential statistics – estimations based on a curve-fitting algorithm such as estimated low, estimated high, estimated percentage out-of-spec, etc.
See statistics definitions and equations in [Dimensional Engineering News, October 2003 and August 2004]. (Available through the DCS Community Site. Simply register for instant access - use the Register link in the upper right corner)
A brief definition for those who may be rusty: A statistic is calculated from a certain number of samples randomly drawn from a population. If all the members of the population are used in the calculation, the result is a parameter, and often referred to as the “true” value. To estimate how well a statistic predicts the value of the parameter of the entire population, its confidence interval may also be calculated. A confidence level, frequently 90%, 95%, or 99%, is first chosen, and then the upper and lower limits of the confidence interval are calculated.
The confidence level is then the probability the parameter is within the confidence interval.
A common and critical concern asks “What is the proper number of simulation runs when performing a Monte Carlo simulation?”
In the following, the recommended number of runs is calculated based on the confidence interval of the standard deviation.
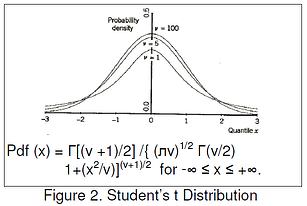
This is the distribution used when adding v squared normal-distributed random numbers.
The distribution has one parameter v, degrees of freedom.
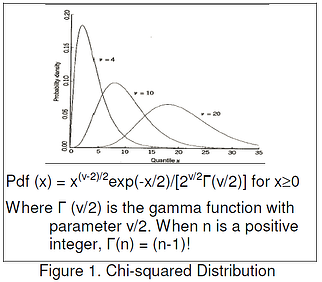
Let
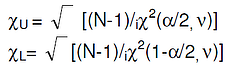
Define the Confidence Interval Factor for standard deviation  as
as
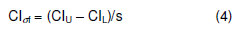
From EQs (1-4), the Confidence Interval Factor can be obtained as follows
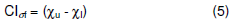
So, the  is the ratio of the confidence interval of the standard deviation to the standard deviation of samples. A smaller will correspond to more accurate simulation statistics. Table 1 provides values for
Confidence Interval Factors based on EQ (5) for three confidence levels and five different numbers of samples.
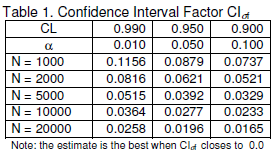
Table 1 can be used to select the number of Monte Carlo simulation runs. For example, if a simulation is made with 5000 runs the is 0.0392 with a confidence level of 95%. Therefore, the “true” value of the standard deviation is 95% probable to be in the confidence interval with a range of 3.92% of the standard deviation. The confidence limits are not perfectly centered about the standard deviation, but they are centered enough that the standard deviation can be said to be within 2% of the “true” standard deviation. If 20,000 samples are run, then the standard deviation is estimated to be within 1% of the population standard deviation.
It should be noted that in the case of a variation model, the population is the infinite set of simulations that could be run.
Therefore, the can help determine if running more samples might significantly change the results. Since the accuracy of the model depends on many factors beyond the number of samples run, more samples do not necessarily increase the predictability of the results.
Although standard deviation was chosen to determine the number of samples needed, confidence intervals are more commonly calculated for the mean and a factor could have also been based on it.
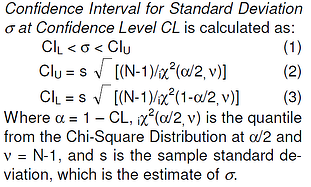
Level C is calculated as:
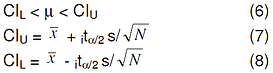
Where ![]() is the quantile from the Student’s t Distribution at
is the quantile from the Student’s t Distribution at  is the sample mean, and s is its standard deviation.
The distribution has one parameter _ = N-1, degrees of freedom.
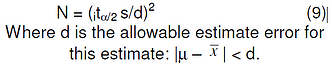
The required sample size N is approximated as:

What is a Confidence Interval?
Applying Confidence Intervals To Dimensional Analysis
Authors/Editors:
Ying Qing Zhou
Earl Morgan
Thagu Vivek
Victor Monteverde
Contributing editor – Brenda Quinlan


2805 Bellingham
Troy, Michigan, USA 48083
Call us: +1-248-269-9777


No Comments Yet
Let us know what you think