 Total Quality Assurance of Aerospace Components Applying Process Capability Analysis
Hosted by The Boeing Company, this year's event will feature keynote speakers from Boeing, Airbus, NASA and the United States Air Force. It is the perfect opportunity to network with key actors in the aerospace industry as well as get up to speed on the latest innovations and developments from aerospace OEM's, customers and suppliers.
As a client to many of the world's aerospace OEM's, DCS will be exhibiting (BOOTH 817, come on by and say hello, I'll be there) as well as presenting a case study during the panel discussions.
Presented by DCS vice president of sales, Donald Jasurda, the paper describes a use case developed by DCS highlighting 3DCS Variation Analyst with QDM - Quality Data Management to connect processes and increase manufacturing efficiency.
In more detail:
The paper focuses on a proof of concept for an aircraft fuselage assembly to monitor the process capability of machined parts at an aircraft original equipment manufacturer (OEM) and their supply chain. Through the use of standardized measurement plans and statistical analysis of the measured output, the paper will illustrate how stakeholders can understand the process performance details at a workcell level, as well as overall line and plant performance in real time.
This ideal process begins in the product engineering phase using simulation to analyze the tolerance specifications and assembly process strategy, with one of the outputs being a production measurement plan. This establishes clear guidelines for consistency in the inspection process. The measured data generated during the inspections is aggregated, analyzed and reported as a process capability index. This index is monitored in real time to track quality status across the organization. Issues are identified, reported and resolved using root cause drill downs to find the source within seconds or minutes of the measurements being made.
By showing production variation based on data, aircraft manufacturers are creating actionable reporting and quality tracking for process capability at their production sites, on a continuous and nearly instantaneous basis.
Here is a snippet from the paper:
Using a Quality System for Problem Identification
As the system provided various methods of monitoring and tracking quality, it was also important to be able to quickly identify issues and resolve them.
Figure 16 shows an automated report with a number of KCC's outside of the given specification limits. It is clear with just a glance by the red color coding that there is an issue with the gap on the tail fin skin sections. The pass/fail criteria set to a specified Cp, shown here at 0.55. The summary, as shown in Figure 9 quickly highlights which points meet or fail the given criteria.
Let’s focus on a point that has failed to pass the given criteria. Figure 17 magnifies the run chart associated with the point.
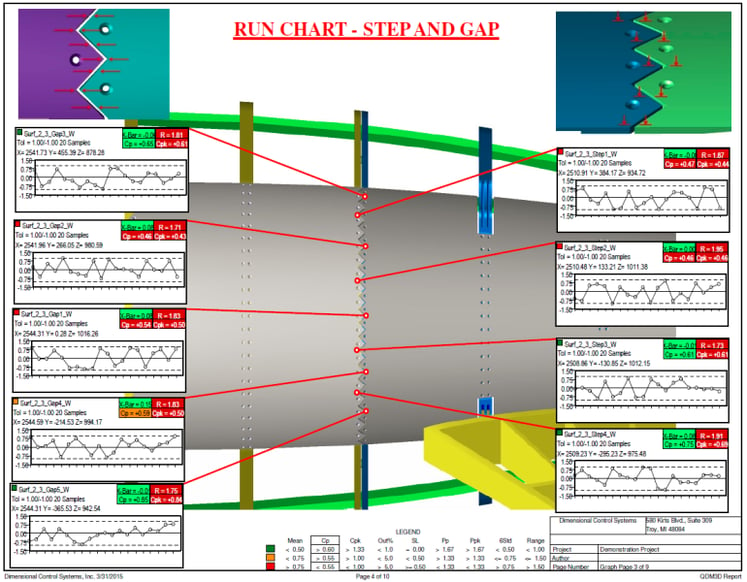
Figure 16. Run Chart Automated Report
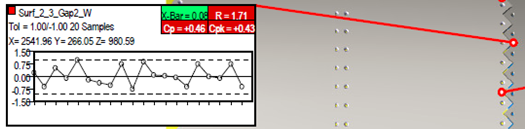
Figure 17. Run Chart with Out of Specification Points
The lower and upper tolerances are set at 1.00 mm, with the last twenty inspection samples shown. As shown, two samples are outside the limit, with at least six near the limit. Clearly, there is either an issue or the specifications are set too tightly. Let's assume that the specifications are set are required levels to meet the quality standards set forth by the OEM. Therefore, there is an issue in production.
Pulling up the specific part by part number in the system, a report can be selected from the given templates. In this case, a more detailed summary reports is created as shown in Figure 18.
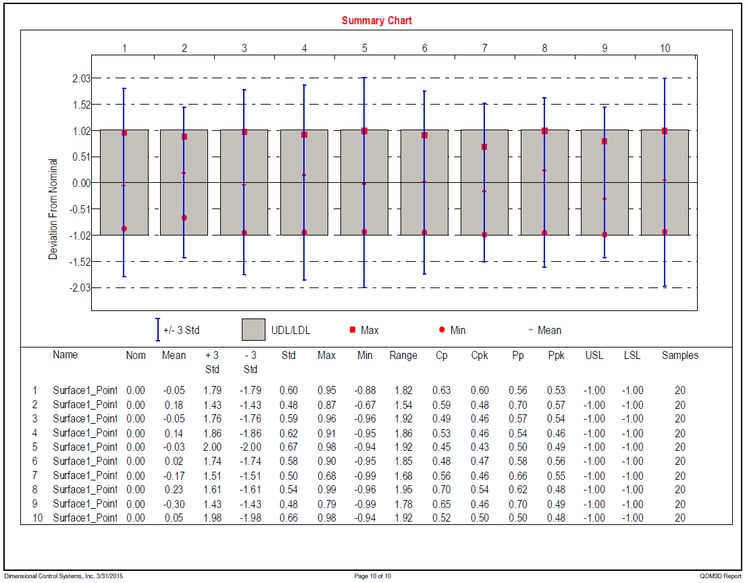
Figure 18. Summary Chart of Statistics for Fuselage Section Connections
The focus here was on point 2, Surface1_Point. However, glancing over the data, other points along the same line have larger ranges, with lower Cp and Cpk's. The issue is not the single point, but the entire gap along these two components.
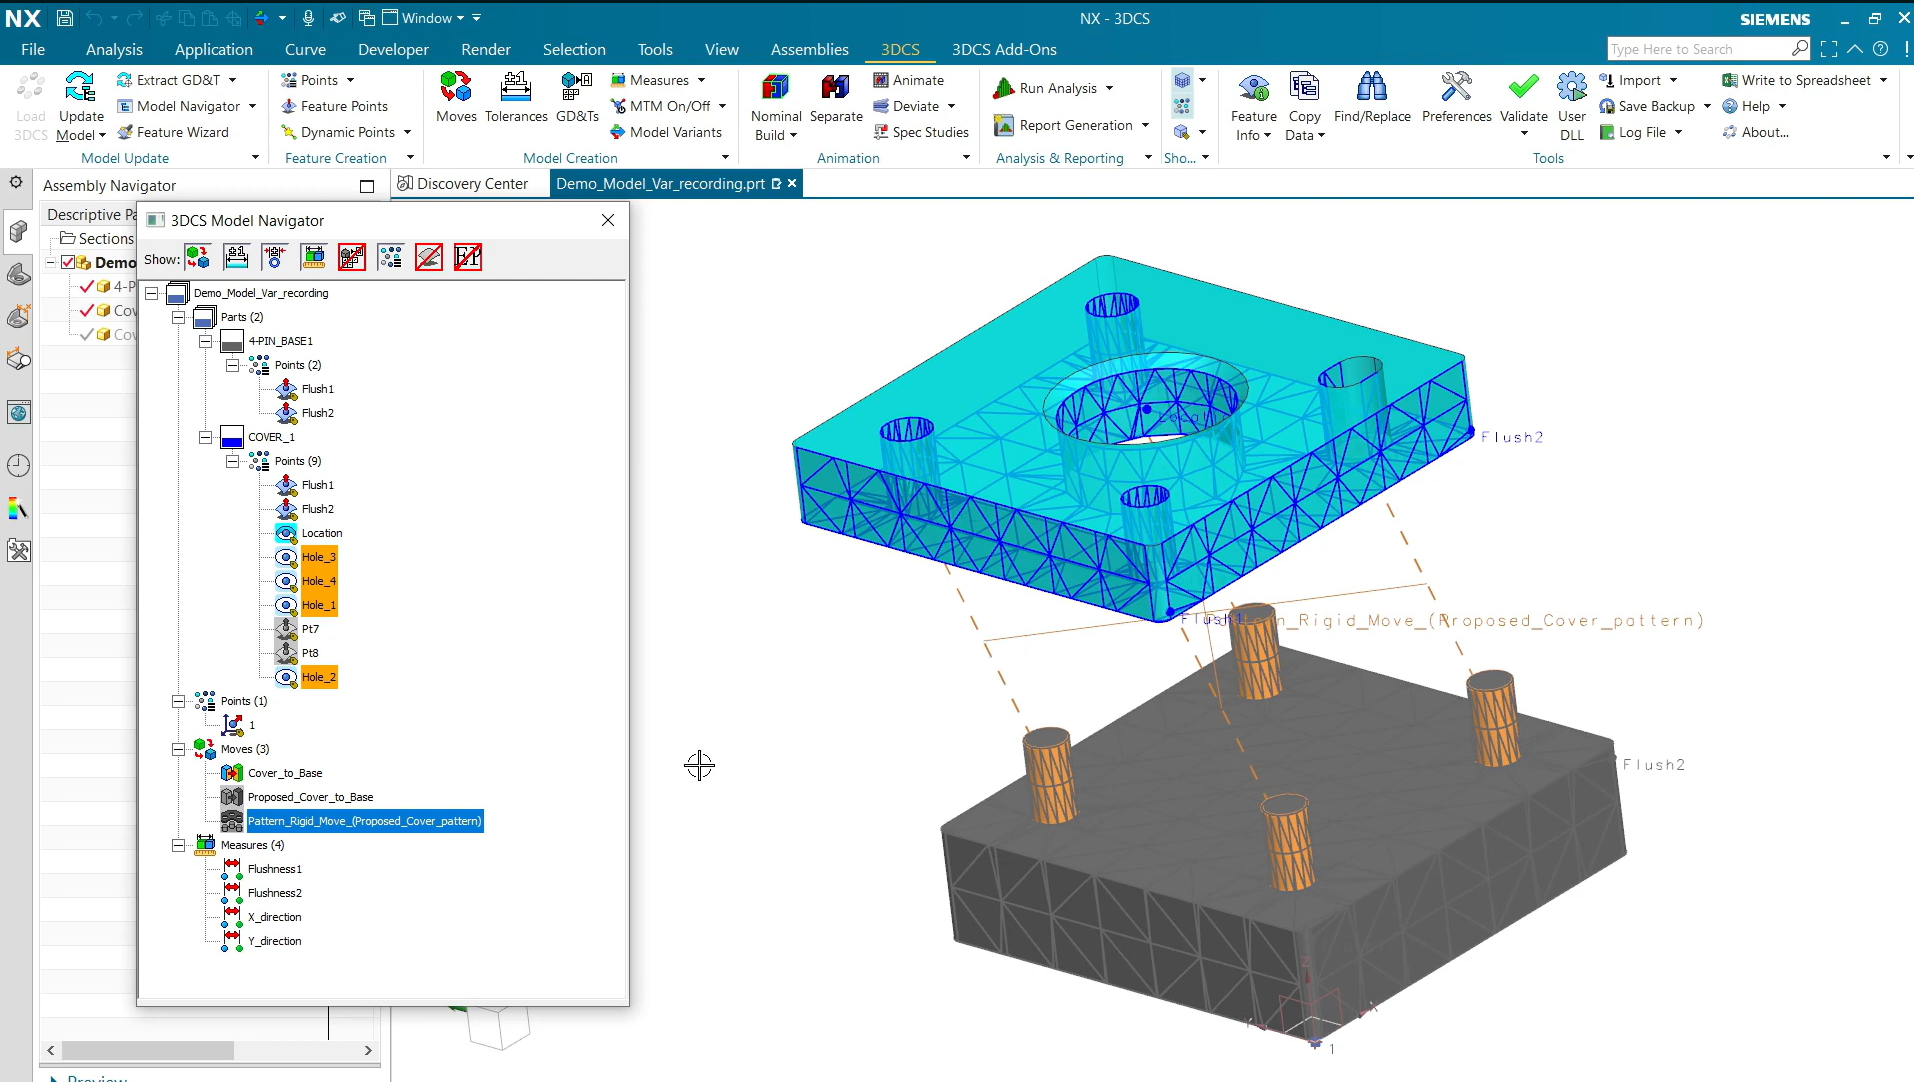
Pulling the data out of the system by exporting a text file as shown in Figure 19, the inspection information was brought into 3DCS and applied to the CAD model. The gap being analyzed is at the connection point of two sections of the fuselage.
***
Download the full paper at SAE's website: http://papers.sae.org/2015-01-2615/
Download first two pages of the paper here


2805 Bellingham
Troy, Michigan, USA 48083
Call us: +1-248-269-9777


No Comments Yet
Let us know what you think