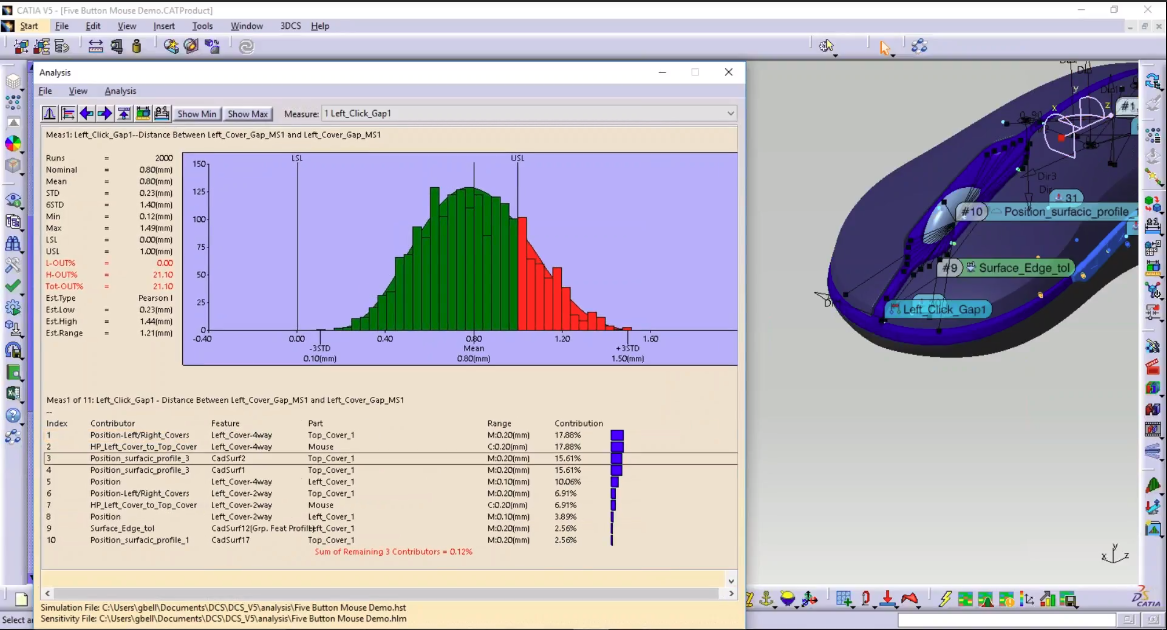
Monte Carlo Analysis, using Monte Carlo simulation with tolerance variables and assembly processes, provides a lot of powerful outputs. Determining percent out of specification, critical features to quality, contributing parts and tolerances to out-of-spec scenarios, and more. These outputs can be used to reduce non-conformance in production, and thereby reduce scrap, rework and overall manufacturing costs.

As anyone who has worked in the simulation environment knows, that's the goal. However, getting there isn't always easy. Most teams responsible for creating simulations then provide that data to managers, quality professionals, plant managers, designers and other teams that have to use that data to make changes and decisions.
Monte Carlo Simulation gives statistical results based on simulated measurements. Models used in industry often incorporate a great deal of information, with the model from ITER as an extreme example. These models produce a lot of results, and sharing that information in a way that is clear and meaningful can be difficult or time consuming.
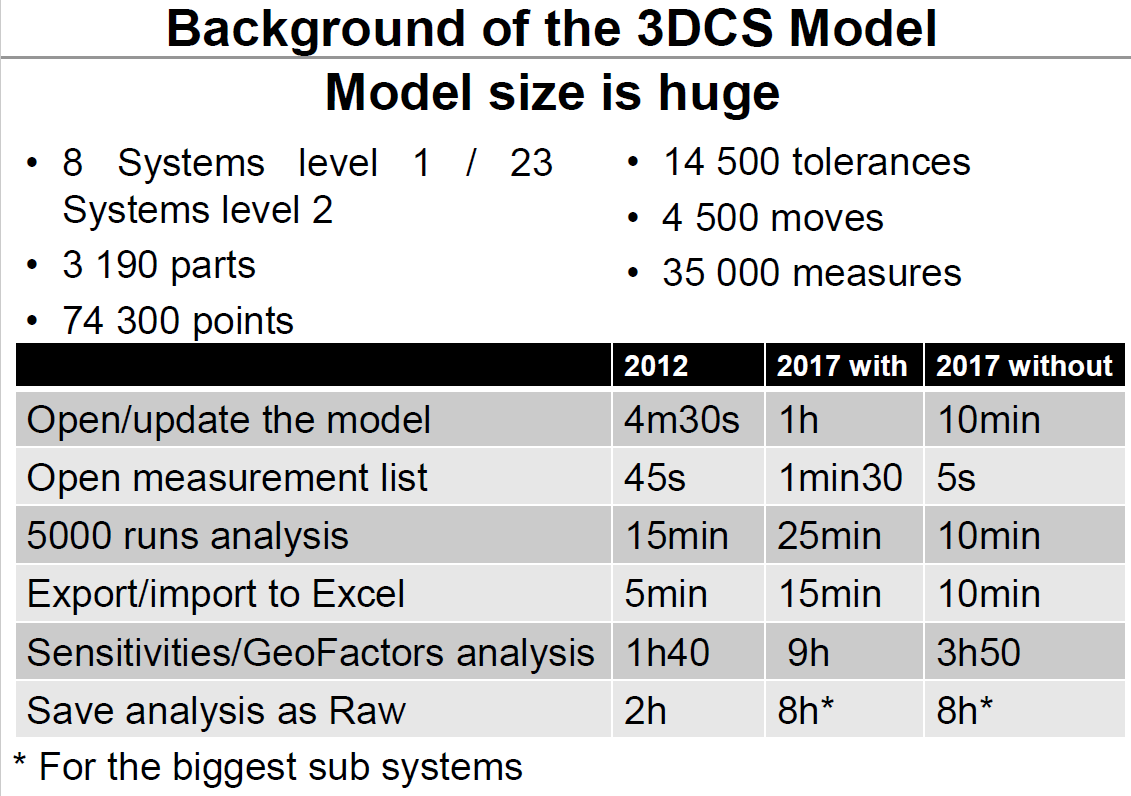
-- ITER Model Features from the 2017 DCS Global Technology Conference --
This is an extreme case, but most industry models aren't four part assemblies with a few assembly moves and three simulated measurements. They are thirty parts, forty assembly moves, eighty tolerances and thirty measurements.
Sharing the results from this model with a management team or decision makers can be difficult. They aren't usually interested in specific tolerance outputs, or each individual parts inputs and outputs. They need to see what is failing, where and how to fix it.
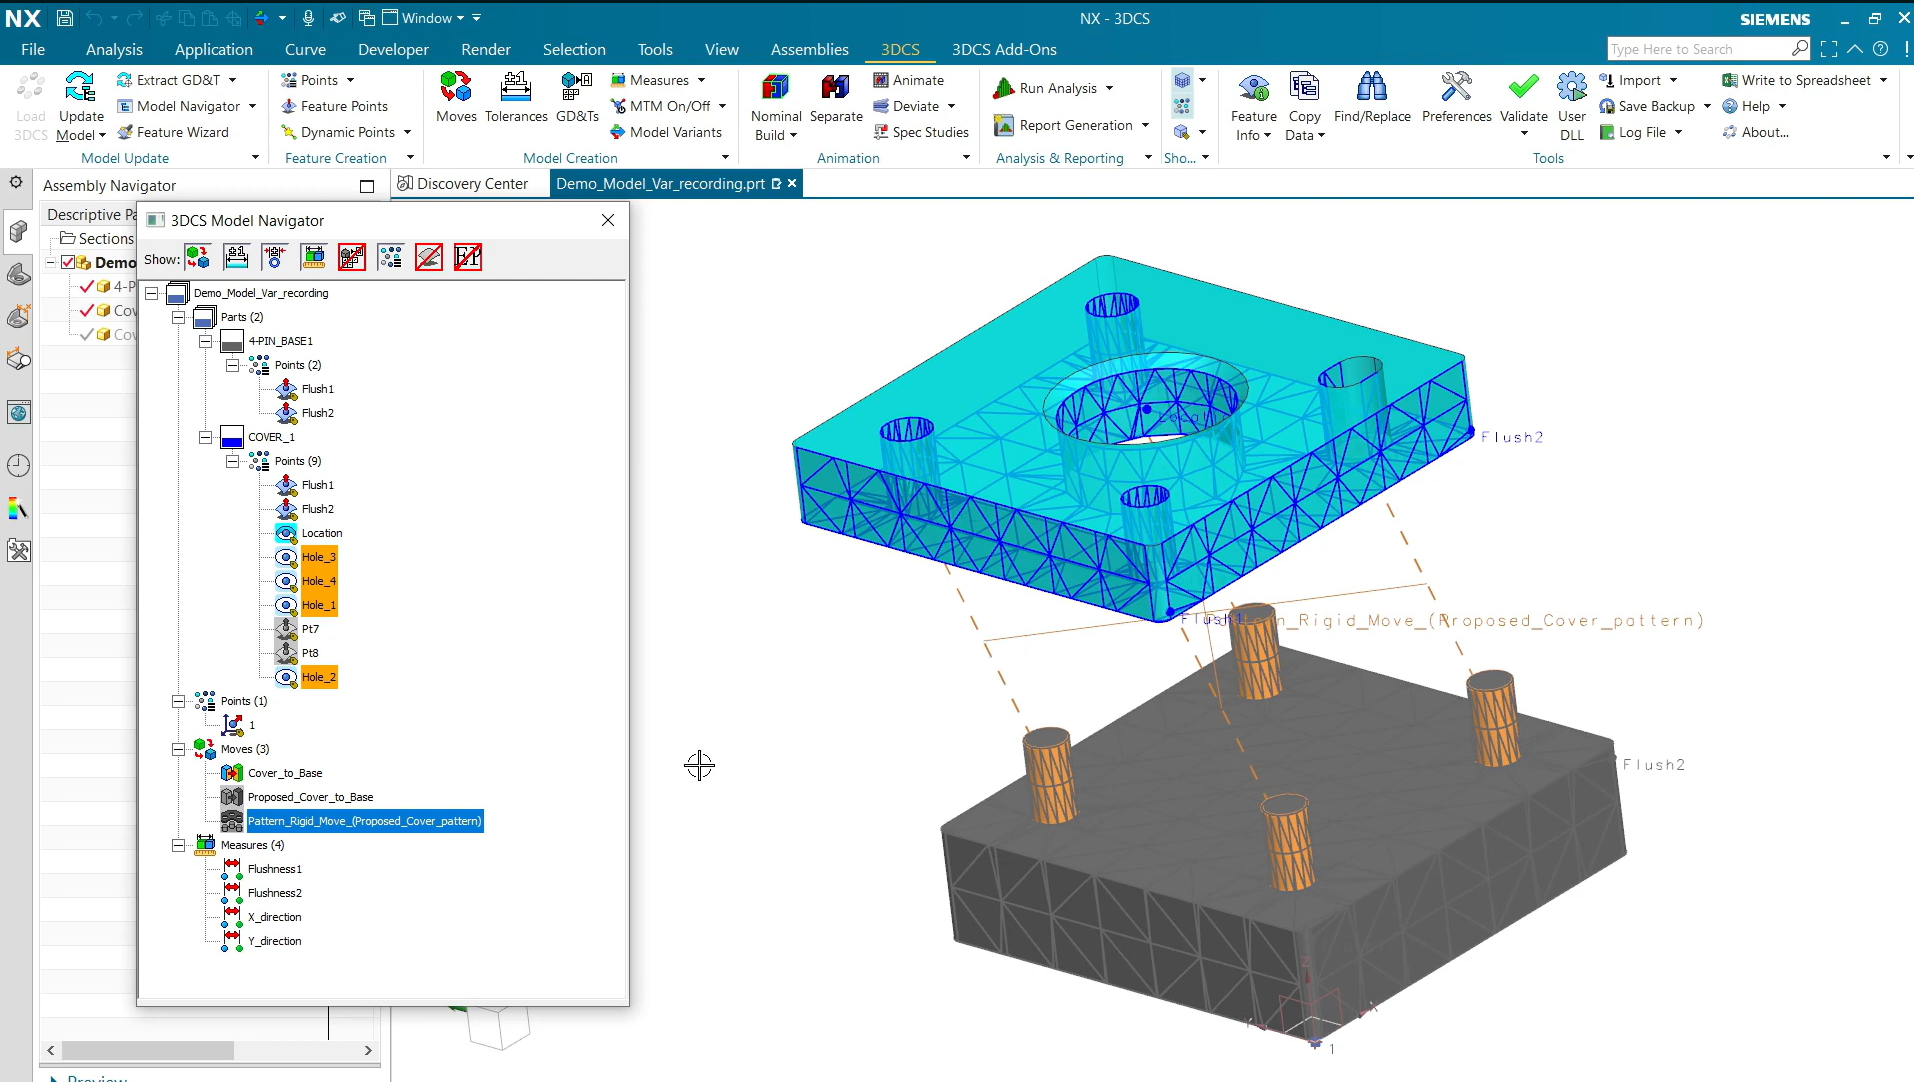
3DCS Variation Analyst uses Monte Carlo simulation to find critical features in your assembly and validate your design. Once the analysis is complete, this information is shared, discussed and used for decision making. To do this, most users create PowerPoint presentations and reports from the 3DCS Report. This can be a painstaking process, as the 3DCS Report is designed to share all of the model information in its entirety, and includes all of the technical inputs and outputs. The users are creating more simplified reports in PowerPoint to discuss specific areas of the model, to share with managers who want a more general or higher level understanding, or to colleagues who want to discuss specific outputs.
The creation of this kind of report can be painstakingly long. So here are two methods of drastically reducing the creation time of more specific reports from your tolerance analysis data.
The one-button reports from 3DCS can now be produced in PowerPoint and other formats. The template can be modified before populating it, letting you set it up to showcase the information you need. Then, when the report is made, you can cut it down to the parts and information you want to showcase quickly. This lets you reuse the template across a range of models and projects as well. Do the work once, and then get the information and formatting you need for all of your models.
The information here is still restricted to the specific outputs of 3DCS. So if you want to showcase your information to managers with pass/fail criteria, or as statistical outputs, this may not be the best method, still leaving you with formatting and work to be done.
Using QDM for 3DCS, the user can generate a management report that focuses on the information you want to show with callouts, graphics and statistics in drag and drop charts. This method provides a clear, informative report that is perfect for showing trouble area (with configurable pass/fail color coding), and uses the CAD model to put all of the information into context to promote informed decision making.
How do you make this report?
I'm glad you asked. Here's a video on how:

2805 Bellingham
Troy, Michigan, USA 48083
Call us: +1-248-269-9777


No Comments Yet
Let us know what you think