Date: March 14th, 2014
Time: 9 AM EST to 11 AM EST
Medium: Gotowebinar
QDM 3D (previously GDM 3D) has had a lot of enhancements and new features added over the last year. The latest version has had improvements designed to save time and make the product easier to use. This allows users to quickly create QDM reports and templates. Not only will these enhancements make it faster to create your reports, but they add new methods of customizing your reports as well to make them unique to your needs.
In this training session you will learn all the new functions of QDM 3D, as well as time saving tips, and see them applied directly to template/report generation. As an interactive session, you will have the opportunity to ask questions and direct the training to address your specific needs. With a dedicated question and answer section at the end, you can ask additional questions and see your answers demonstrated, as well as ask about any enhancements you would like to see.
Perfect for new and experienced users of QDM 3D, this event is a great way to learn new skills and freshen up on current ones.
Registration is Free!
Agenda:
1. Review of Powerful Functionality Enhancements:
Ability to display an Audit % or count of pass fail features on each page.
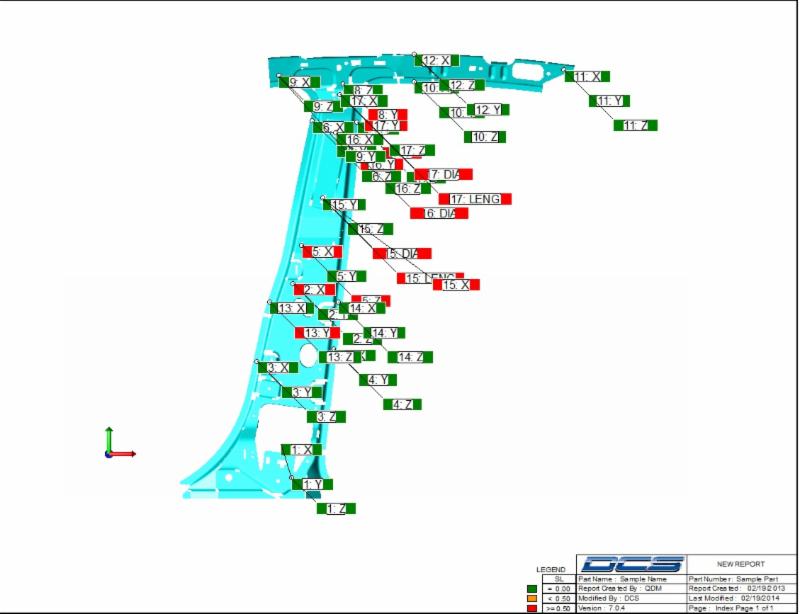
Enhances Statistics chart to display color coded measured values similar to CMM report.
Import and replace data into charts by proximity match ( instead of feature name match)
Ability to handle cpk/ppk calculations for unilateral, bilateral and offset spec limits.
Wizard interface to add a index chart to display the list of samples reported in the QDM report.
2. Review of Time Saving / Productivity/Layout Enhancements
Set charts to display IN/OUT, UP/DOWN, FORE/AFT directions automatically on trend charts.
Direct export of data in Excel format.
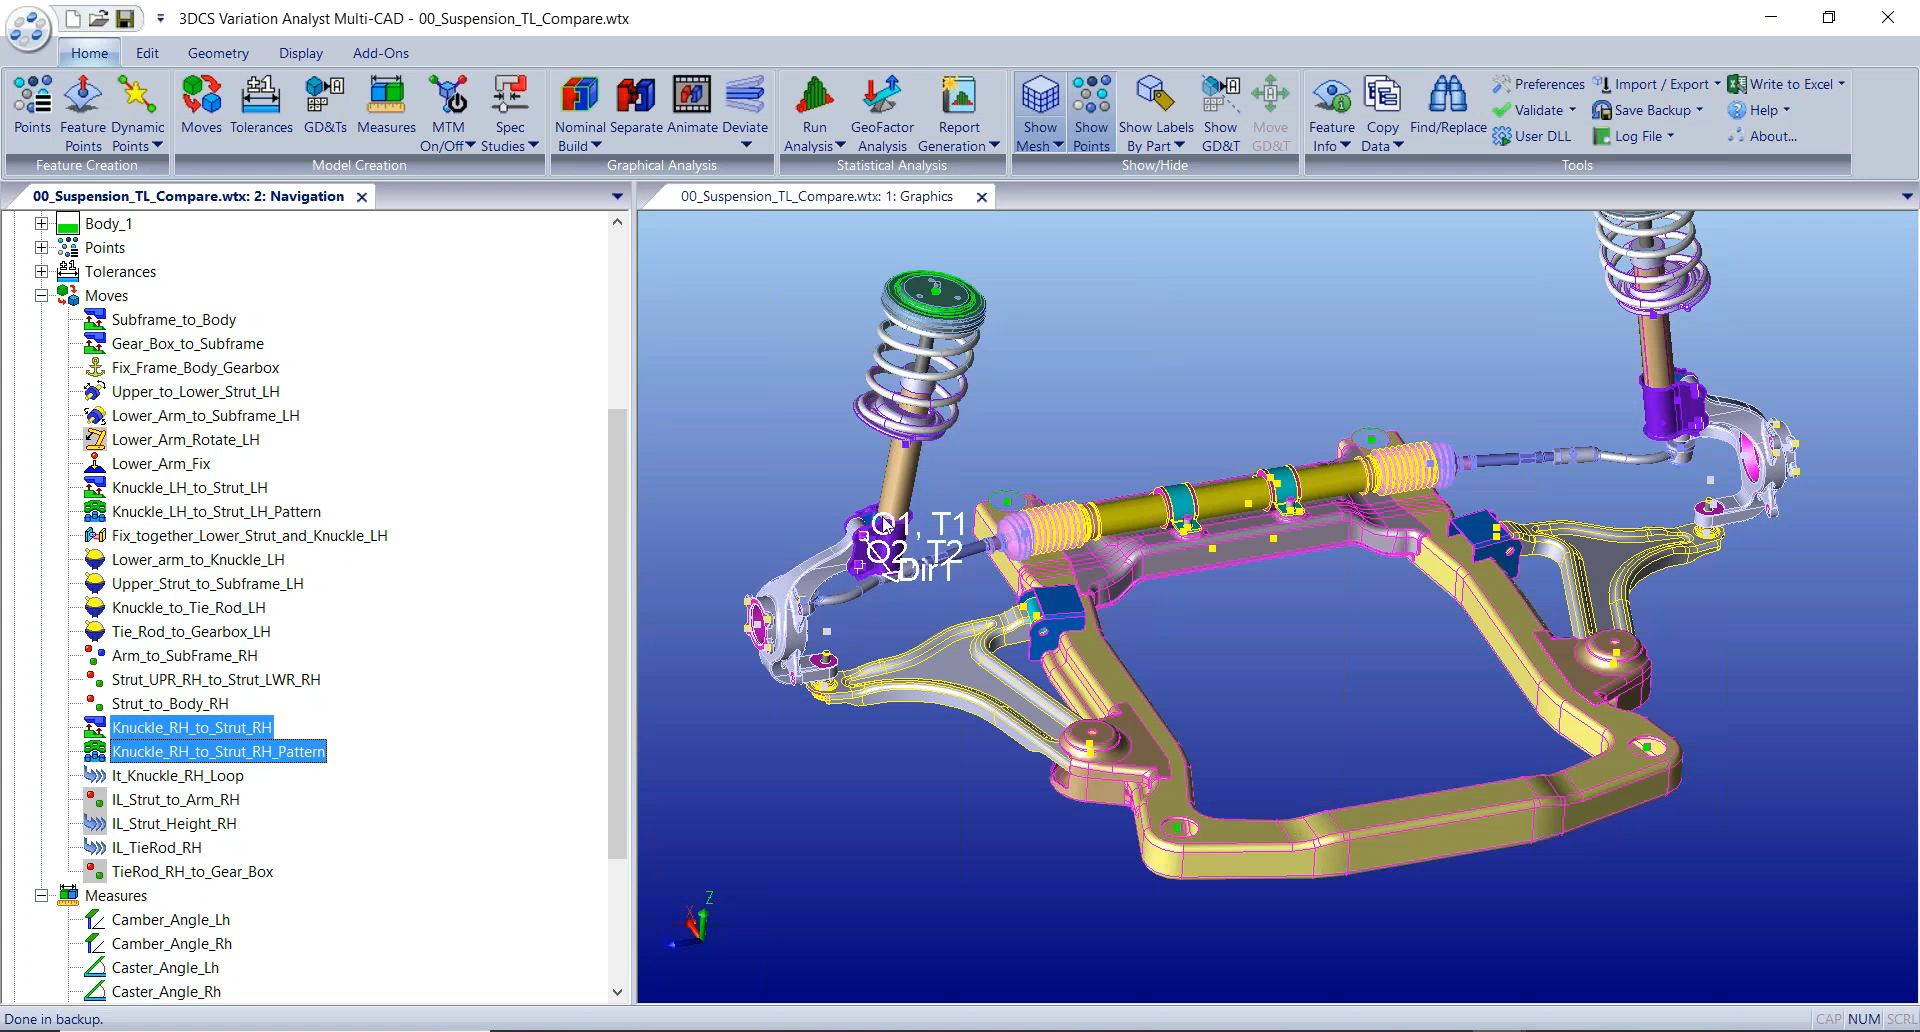
Ability to use Pan, Zoom and Rotate with mouse clicks similar to CAD systems.
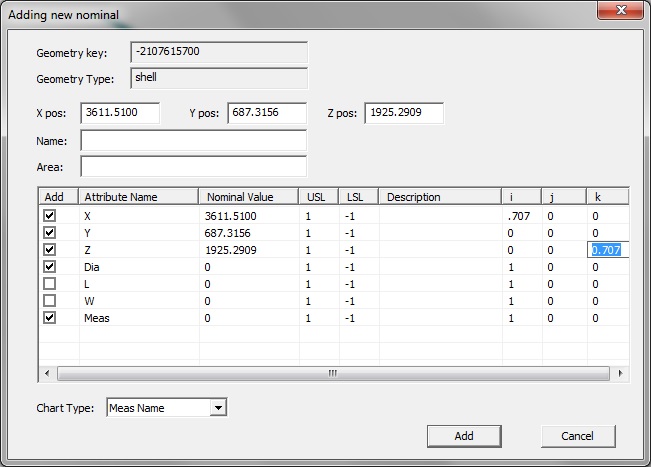
Query the CAD data loaded, to get X,Y,Z location information or create a nominal point/chart at the location.
Index page chart display options to view the Feature Name, Page Number, Attribute Name and more.
3. Q & A Session
Email sales@3dcs.com with any questions

2805 Bellingham
Troy, Michigan, USA 48083
Call us: +1-248-269-9777


No Comments Yet
Let us know what you think