
3DCS’ family has grown and is now unified with Siemen’s PLM System: NX. What this means for NX users is that all the capabilities of NX, including but not requiring Teamcenter, are now working with 3DCS, the industry standard for tolerance analysis. You could even say the two are now working hand in hand…in hand.
 In the production release of 3DCS for NX, we looked at well-known features in NX working with 3DCS. To list a few, these include: NX PMI, using NX Geometry, and pulling points from NX.
For those of you coming from 3DCS Multi-CAD (CAD neutral) and looking to use 3DCS for NX, you are not being left out. You can bring your Multi-CAD files into NX and continue working on your existing models.
This Tips and Tactics explains some key features of a 3DCS Tolerance Analysis Model and how it performs using Siemen's NX CAD software.
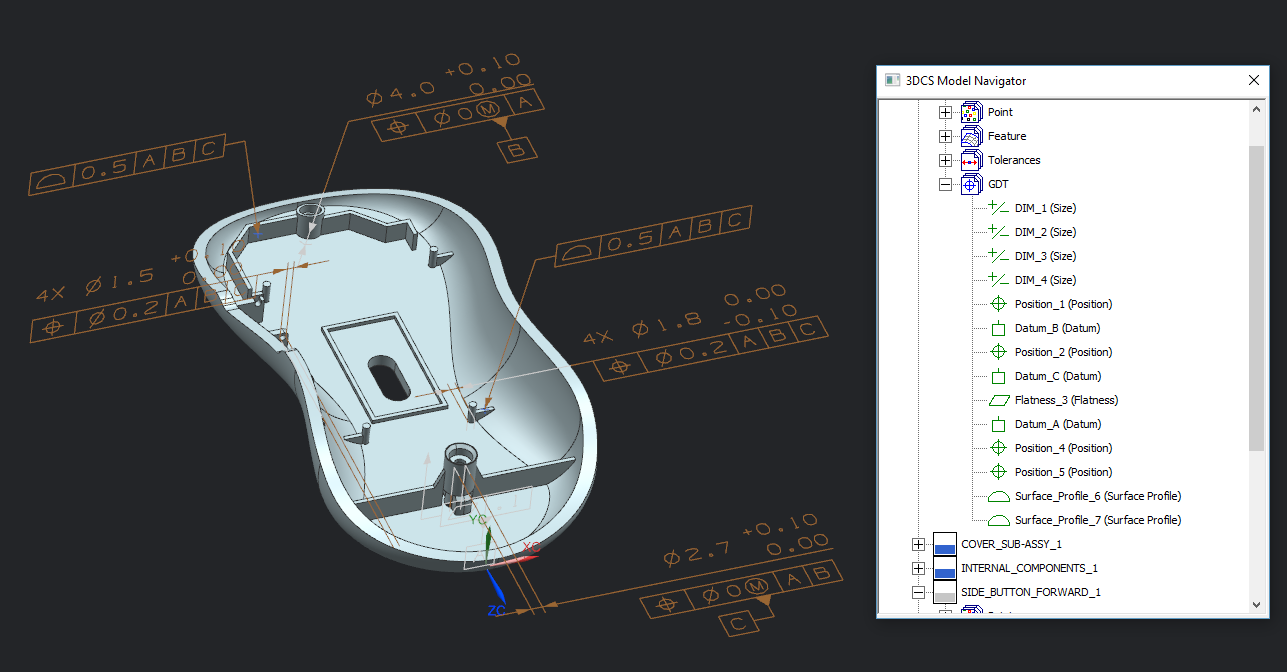
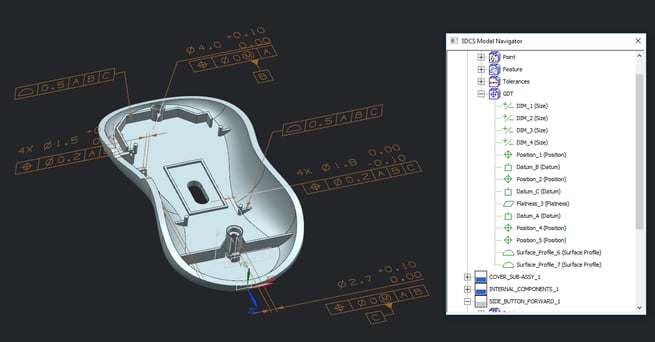
For those who don’t know, PMI is another way of saying GD&T in NX lingo. It represents rules and definitions for the component part tolerances and build processes.
 Most CAD systems can now create drawings with defined GD&T using the actual parts, or create the GD&T directly on the CAD geometry. With 3DCS in NX, the software can read and modify the GD&T from the CAD geometry, simulating multiple build processes and applying the tolerance data.
This allows users to quickly pull their GD&T from NX, and begin modeling and optimizing tolerances right away. This one-button import of PMI (GD&T) makes creating the GD&T entities in 3DCS easier than ever.
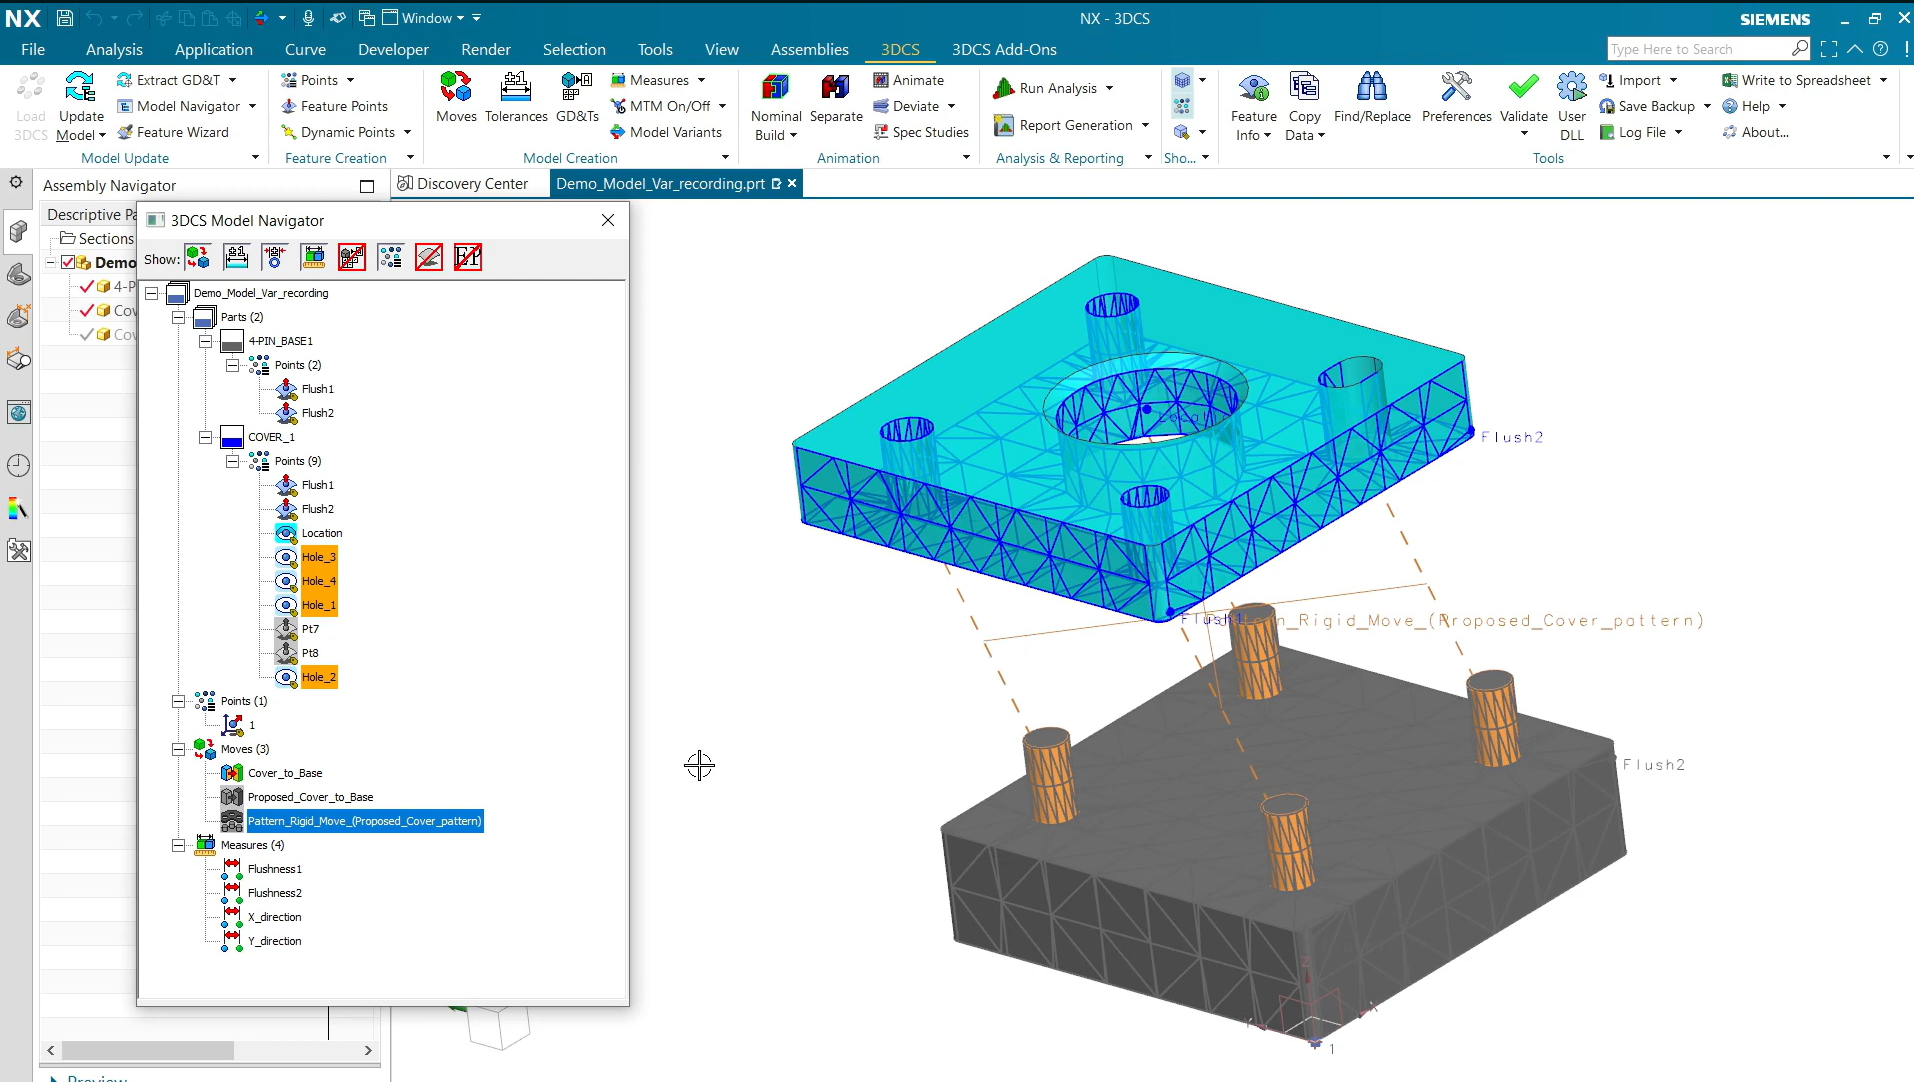
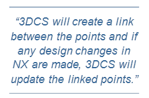 There are currently two ways to build a 3DCS Tolerance Analysis Model. The first method is Point-Based Modeling. Generally, a point-based model involves creating points for the assembly process (called moves in 3DCS), tolerances and measurements. In NX, points are usually created to drive design or to create GD&T datum targets. With 3DCS, users can select those NX points and convert them to either Feature Points or DCS Coordinate Points. When creating Feature Points from NX points, 3DCS will create a link between the 3DCS and NX points. This means that if any design changes are made in NX, 3DCS will be able to read that change and update the position of the point automatically.
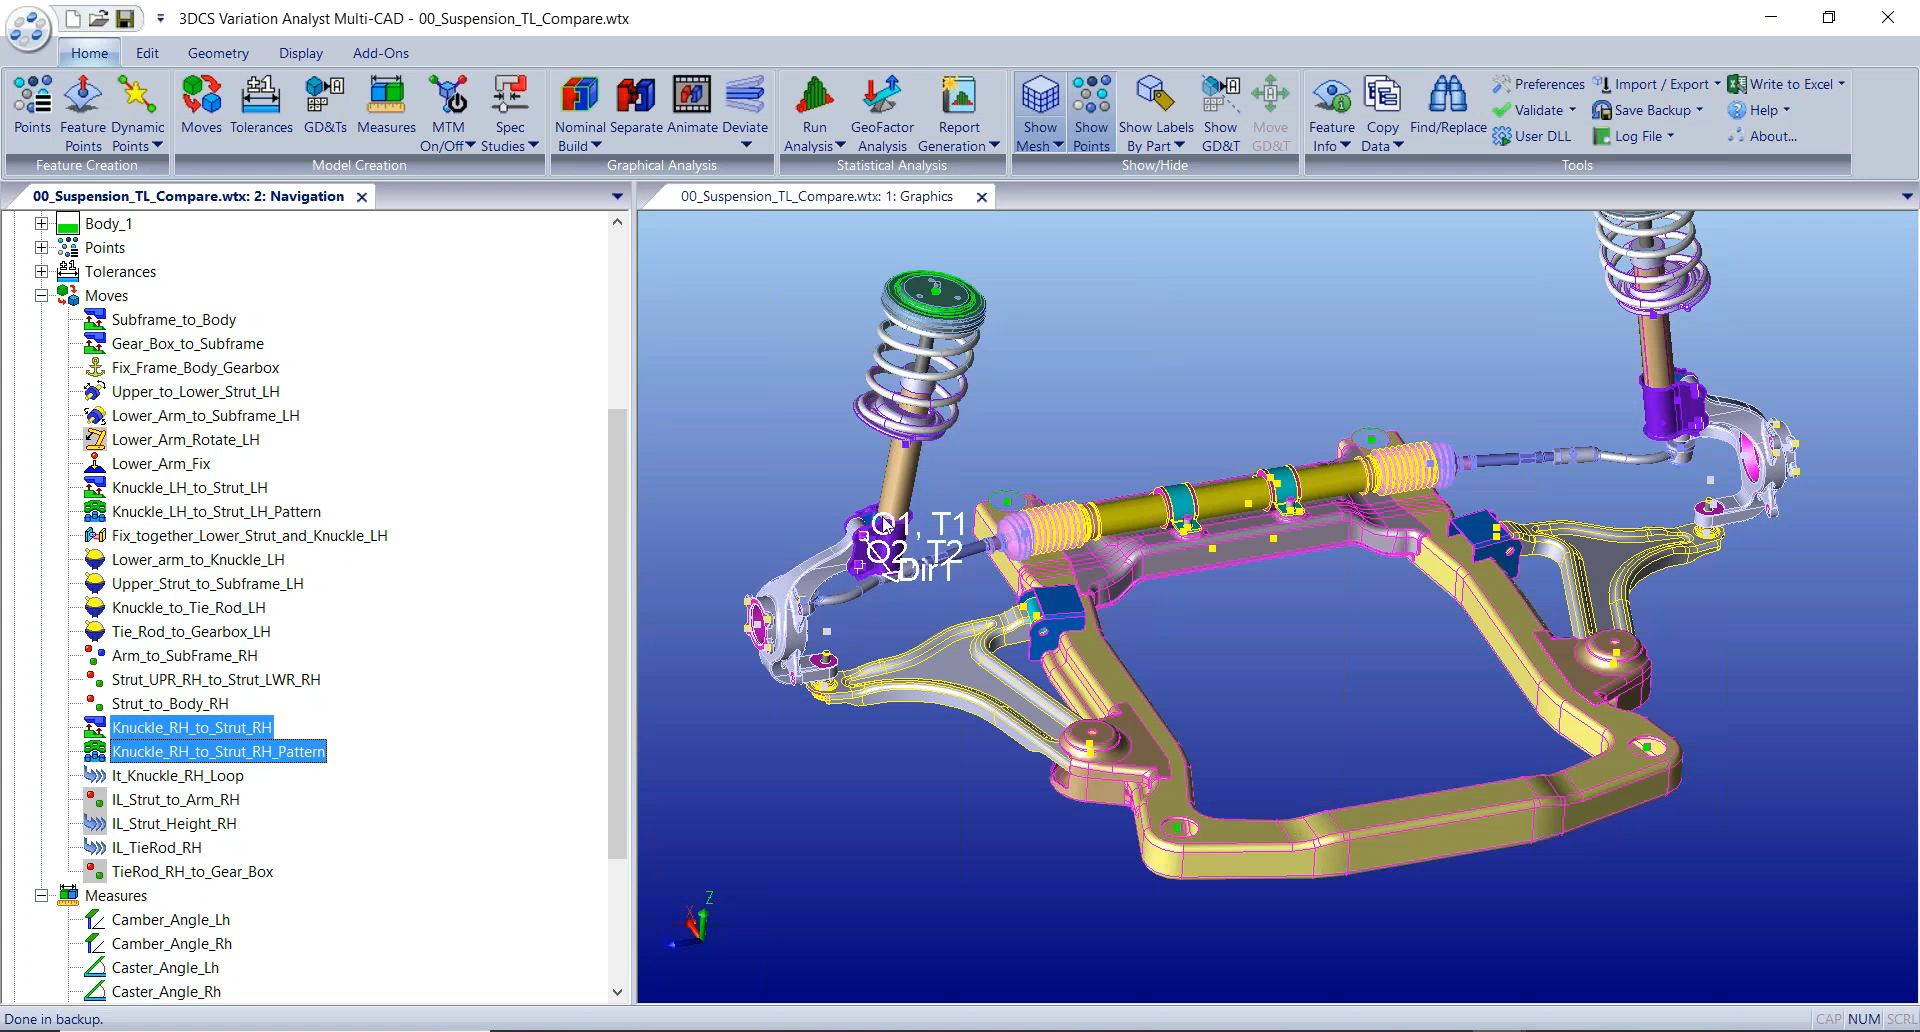
The second method is called Feature-Based Modeling, which is using the NX CAD Geometry to build the Tolerance Analysis model in 3DCS. Similar to creating Feature Points from NX, 3DCS will generate Surface Features and link them between NX and 3DCS. Again, any changes made to the design will be updated in 3DCS.
Now that NX has joined the 3DCS Tolerance Analysis family, there has to be an honorable mention of NX’s sibling: Teamcenter. NX users know how well NX and Teamcenter work together, and now 3DCS will be able to work with Teamcenter as well.
Entities created in 3DCS will be saved with the NX CAD assembly and parts, and remain in Teamcenter together. Launch 3DCS with NX, load the assembly from Teamcenter and you’re off and running. The main assembly file contains all of the 3DCS data and part information. This makes managing models, information and revisions much easier and cleaner.
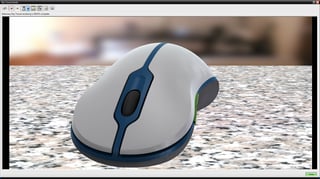
Another branch of the NX family is the Ray Trace Studio (RTS). RTS is another application within NX that supplies users with high end visualization. This adds visual materials to the model and renders the CAD geometry with life like realism.
What does this mean for 3DCS users? Well, just because you’re creating a Tolerance Analysis Model, doesn’t mean it can’t look good.
Adding visualization to your model will add some reality, and paints a better picture about the part, or parts, in question. Later, when producing a report from 3DCS, using RTS on the model could answer questions that could only be answered by viewing the actual part.
Having high end visualization at your fingertips also makes creating Spec Studies and Simulation Studies a breeze. With a few button clicks from a drop down menu, you can add visualization to your model, view your studies, and then revert back to your model to make adjustments. Export a series of images and collaborate with your team and managers about the visual impact of the design variation, or work in tandem with the design team to determine the Perceived Quality impact of design changes and assembly processes. Below is an example of a Spec Study focused on the mouse button.


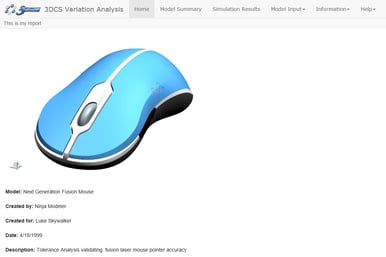
Lastly, the Tolerance Analysis Model Report. The output results of all the work done in 3DCS software. Detailing all of the assembly’s analysis results, this final puzzle piece explains the model in an easily navigated HTML page (or Excel).
The Tolerance Analysis Report brings the whole picture together, showing the Tolerance Analysis Model from beginning to end. This includes the PMI, applying the build process and Measures, real-world images with Ray Trace Studio, geometry, Monte Carlo Analyses, modeling steps and gives customers, managers or colleagues all of the results and given outputs of their product simulations. This report makes reviewing the program, and presenting it, much easier. What's more, with the report, results can be communicated and collaborated on without accessing the software.
Take this one step further to begin authoring your measurement plans (QDM Analyst) and continuing down the PLM cycle.
View the example Tolerance Analysis Report by Clicking Here
Learn more about using 3DCS for NX in the upcoming webinar -
- Jason Brehmer
DCS Variation Analyst
Dimensional Control System
5750 New King Dr. Troy MI, 48098
Phone: 248-269-9777
E-mail: sales@3dcs.com

2805 Bellingham
Troy, Michigan, USA 48083
Call us: +1-248-269-9777


No Comments Yet
Let us know what you think